Incident Manager Dashboard and Report Trend
caHow do I navigate the Incidents Dashboard?
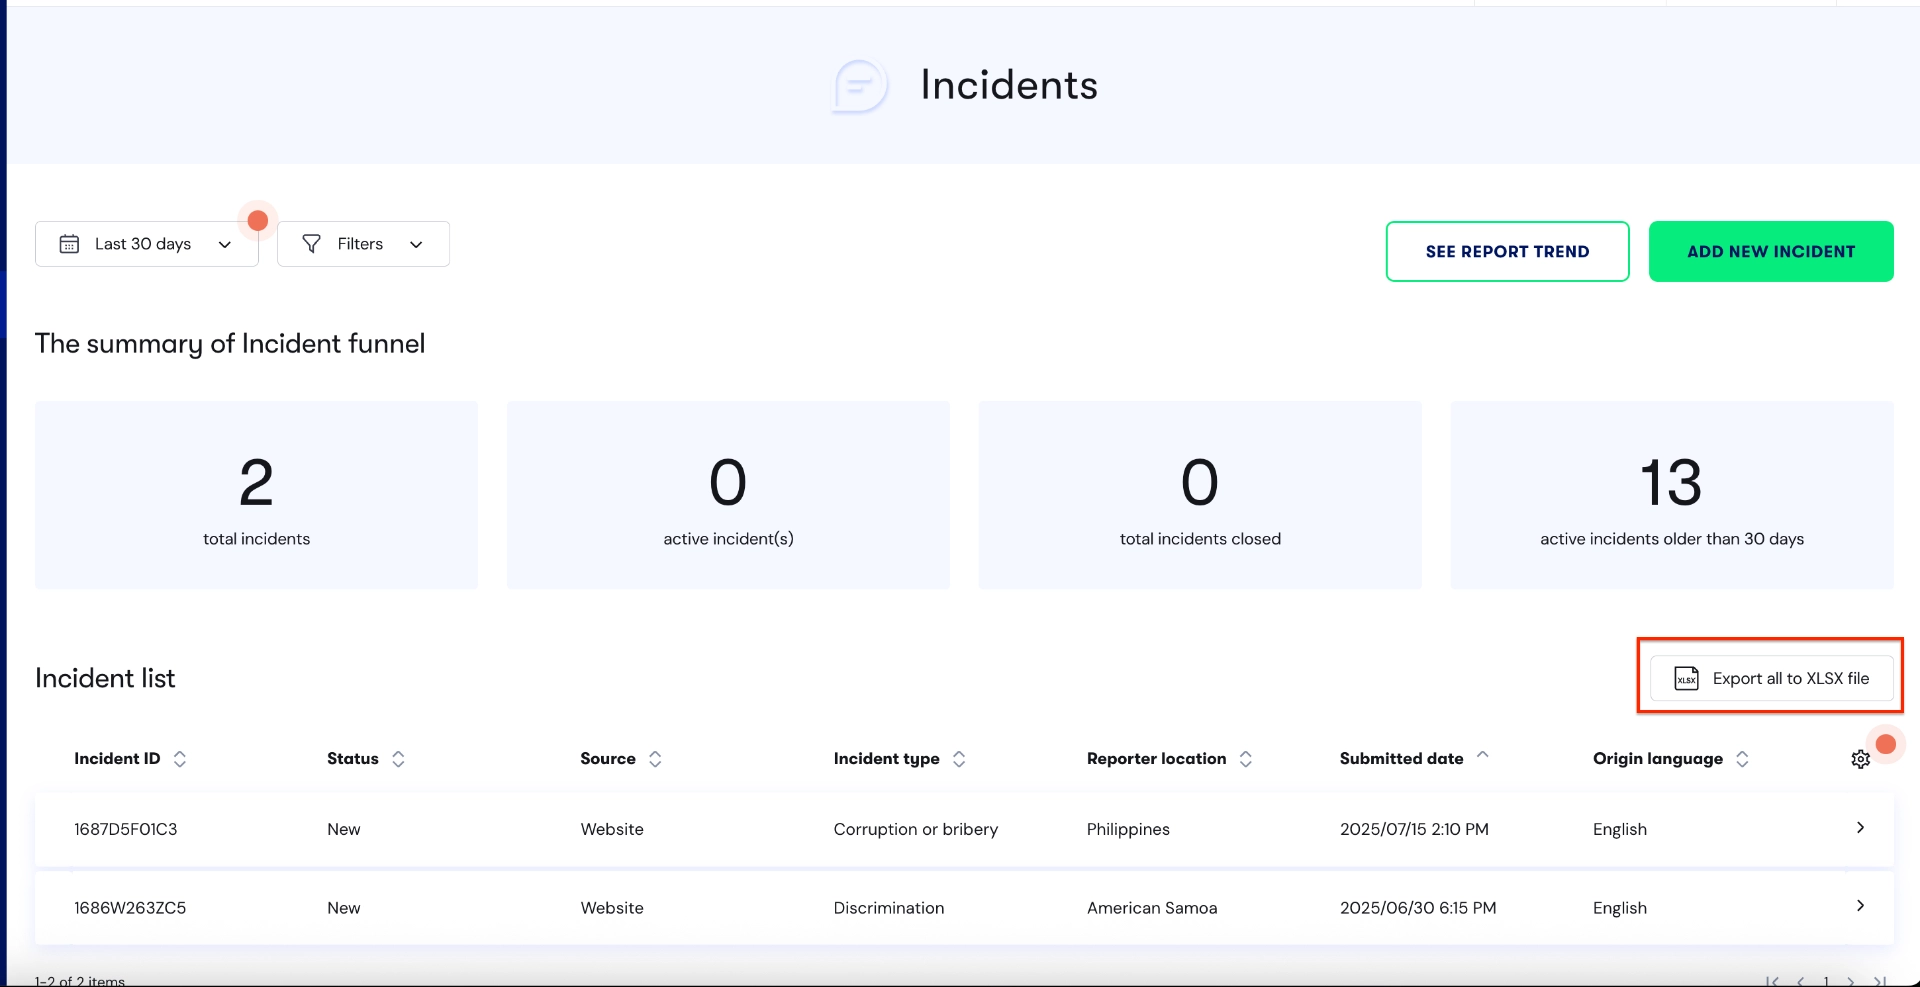
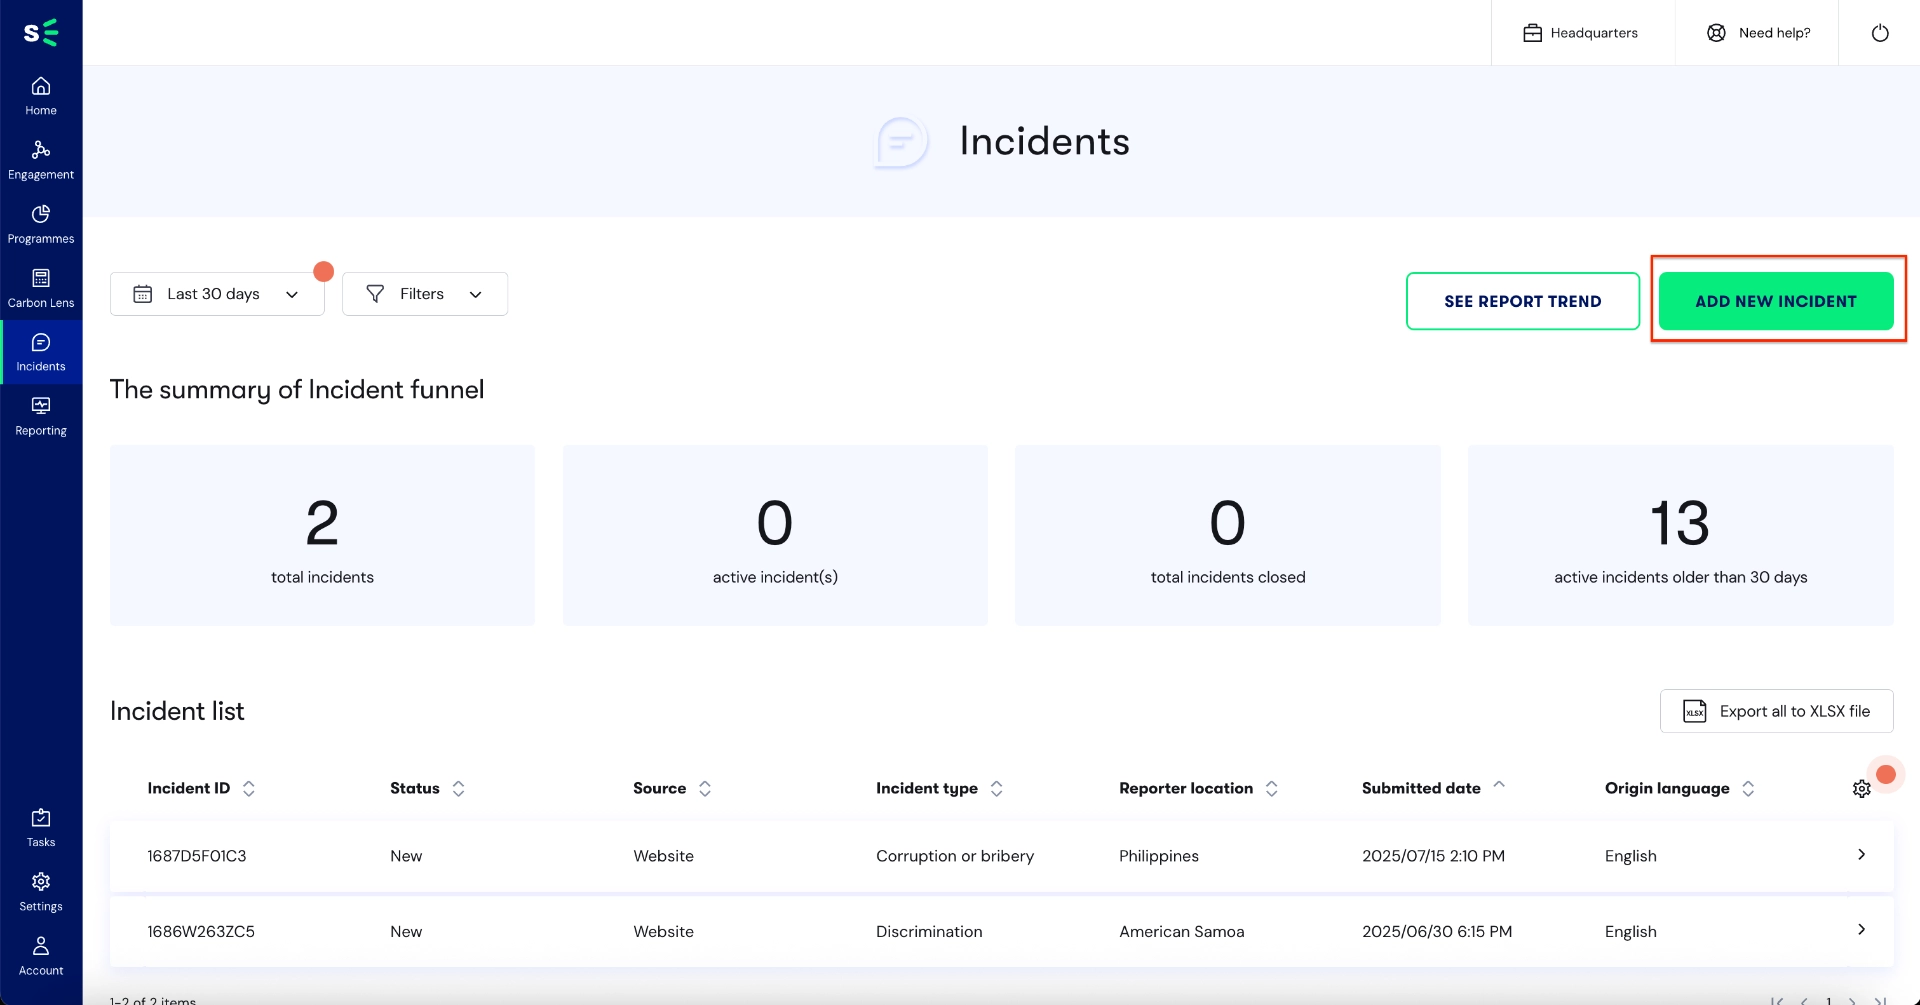
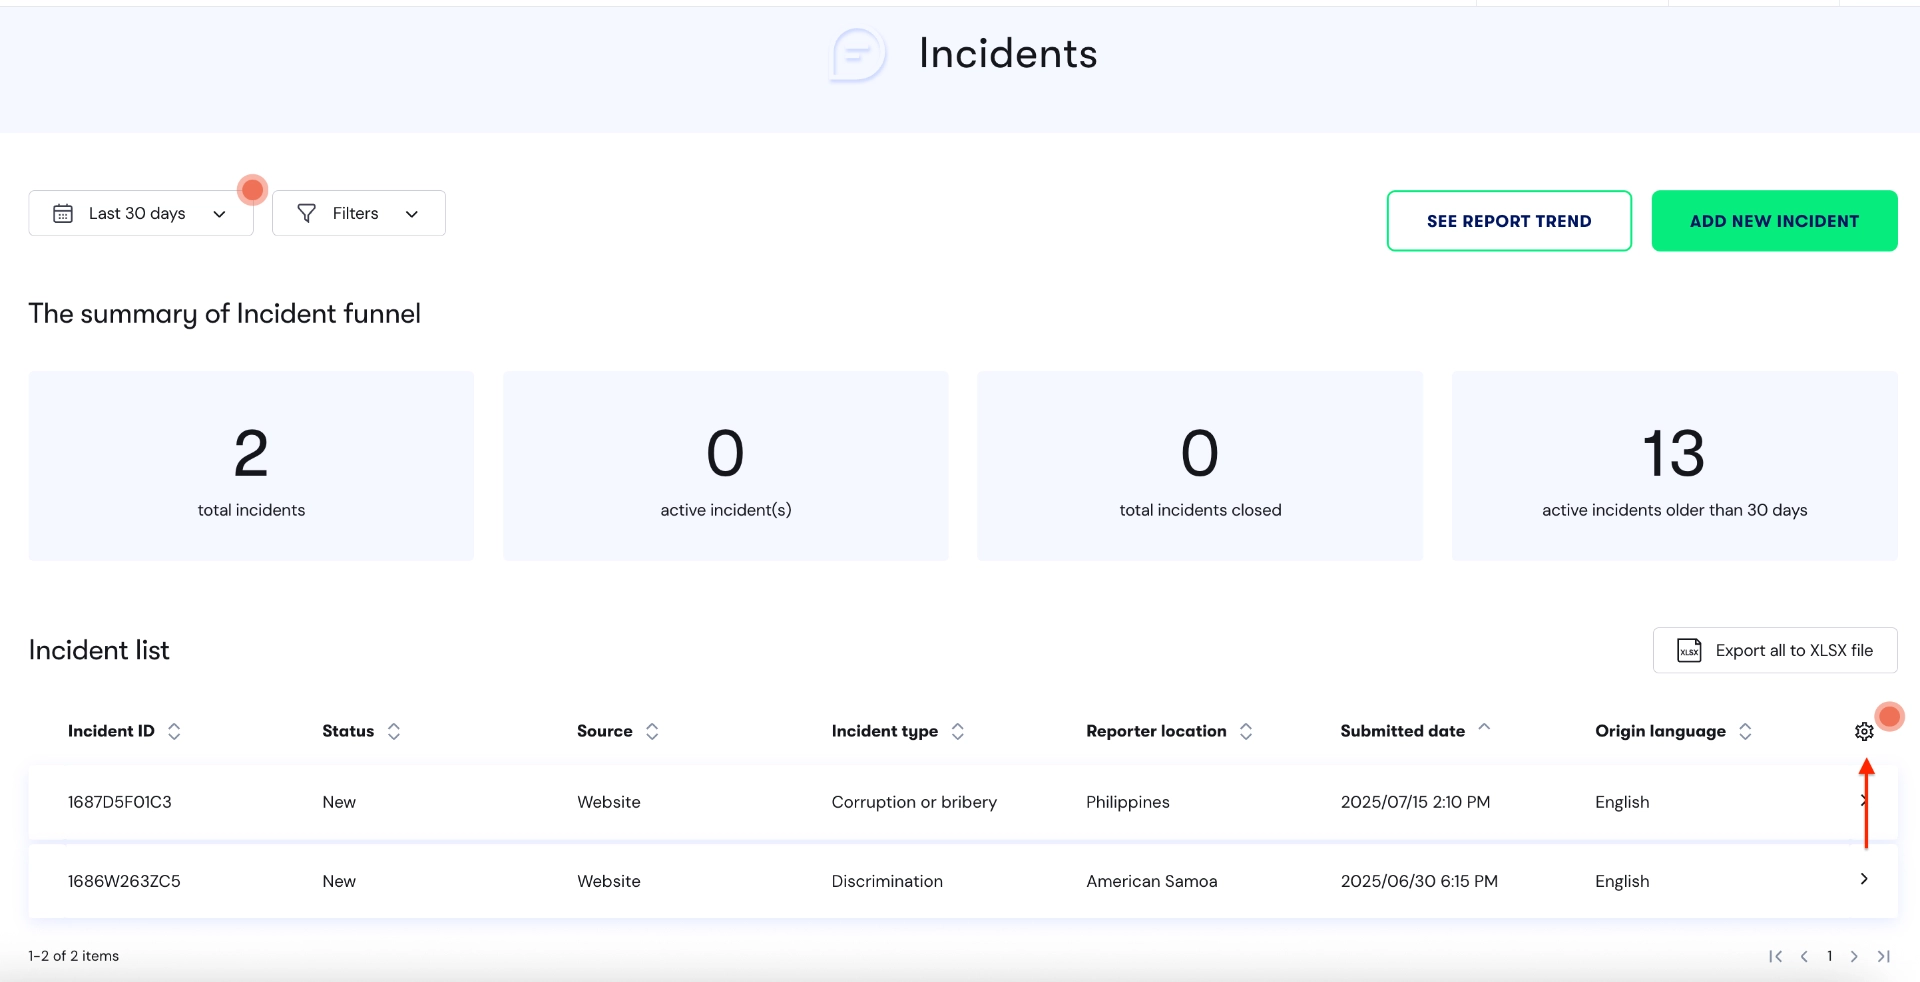
The dashboard displays all reports. (depending on your access level)
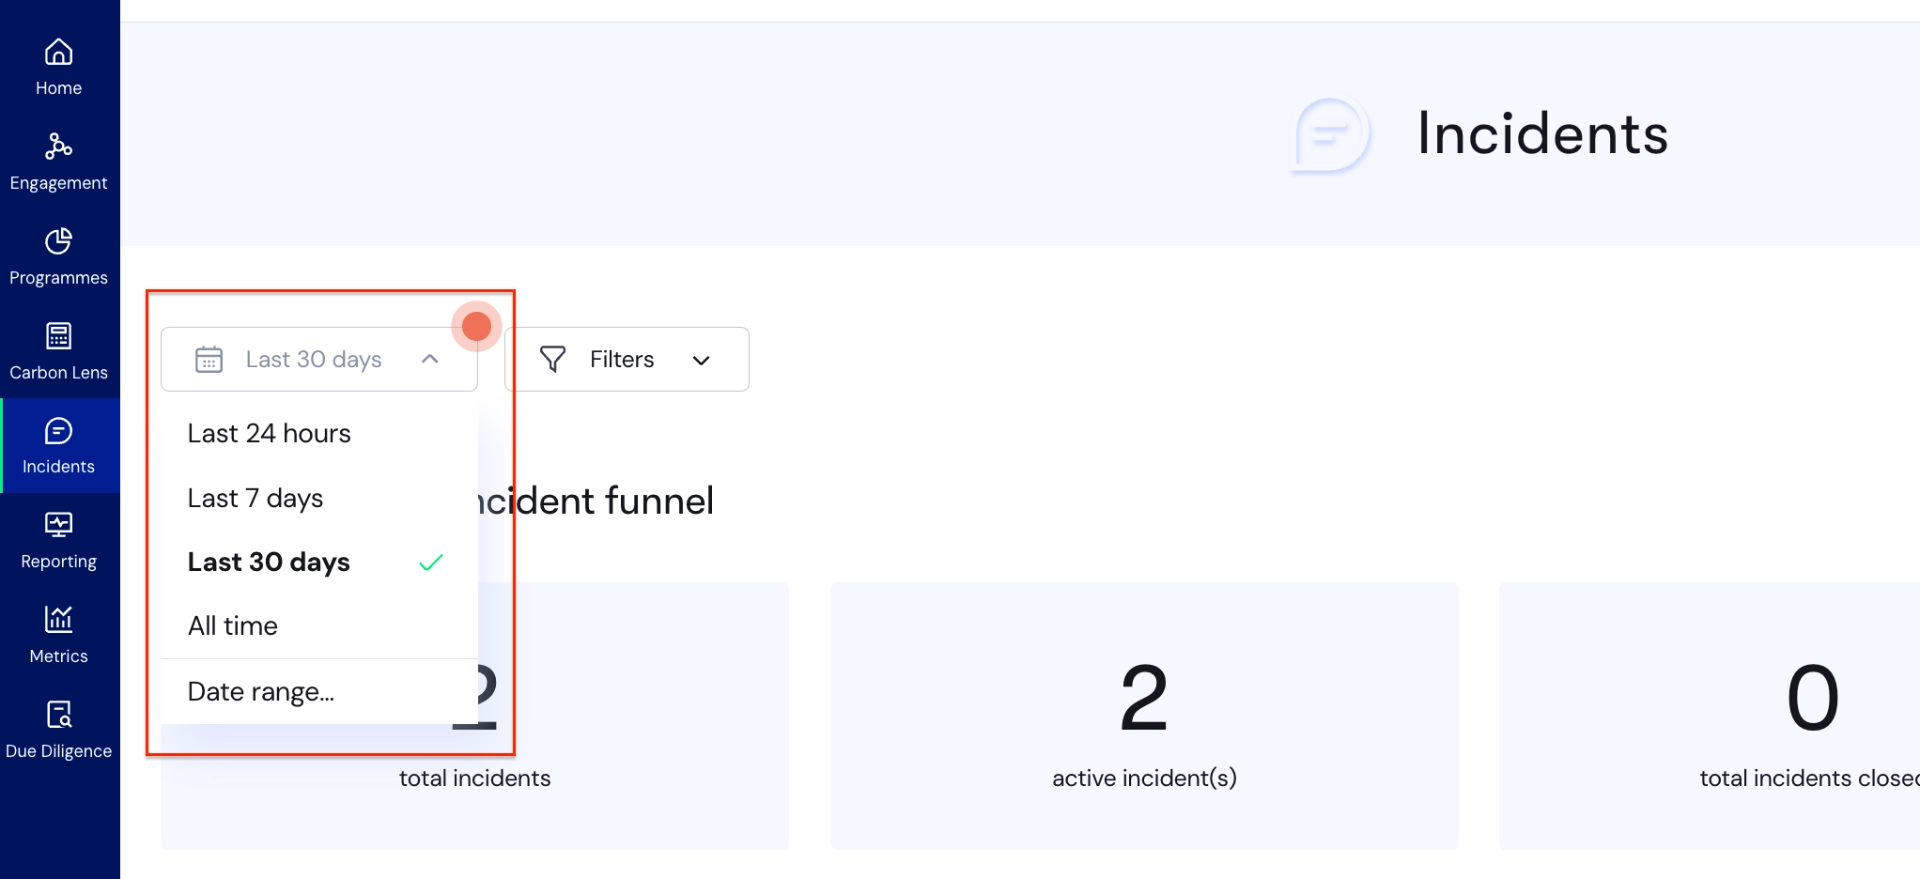
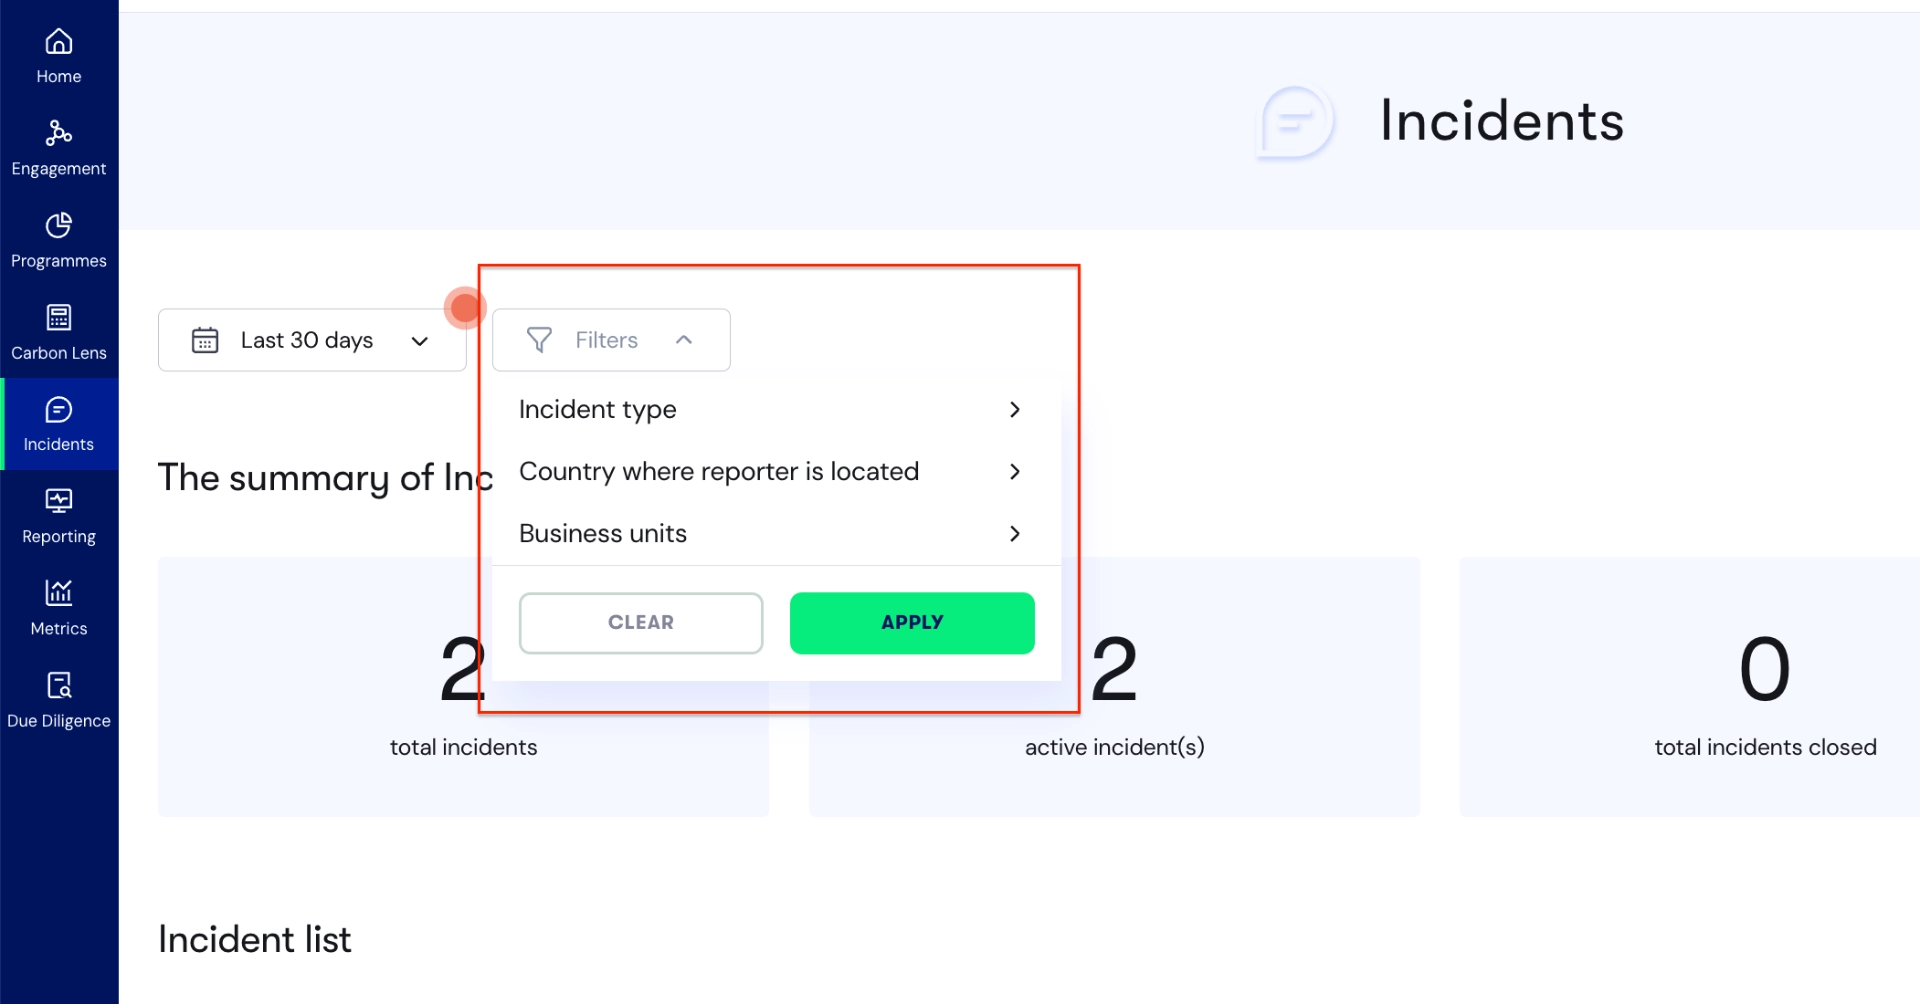
You can choose a date range to view reports or filter on Incident type, Reporter country or Business Unit.
On the right corner above the 'The summary of Investigation funnel', you will see SEE REPORT TREND and ADD NEW INCIDENT button.
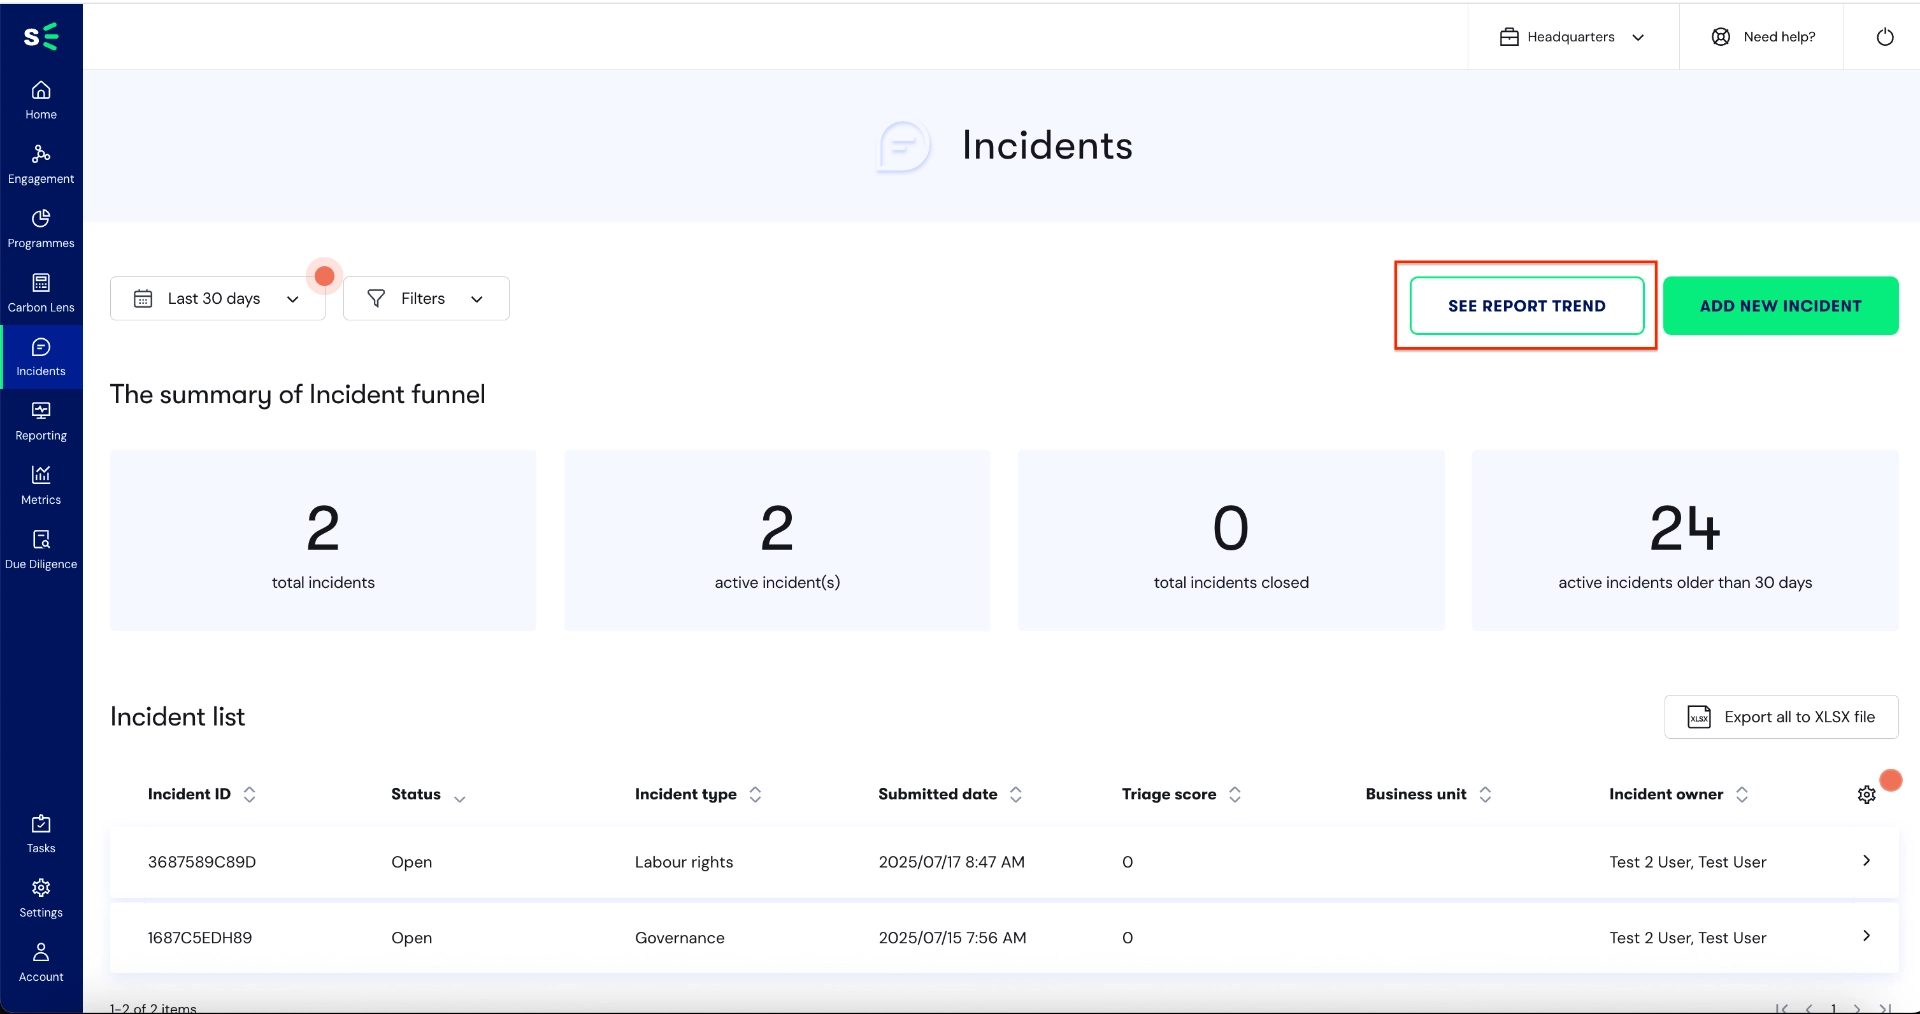
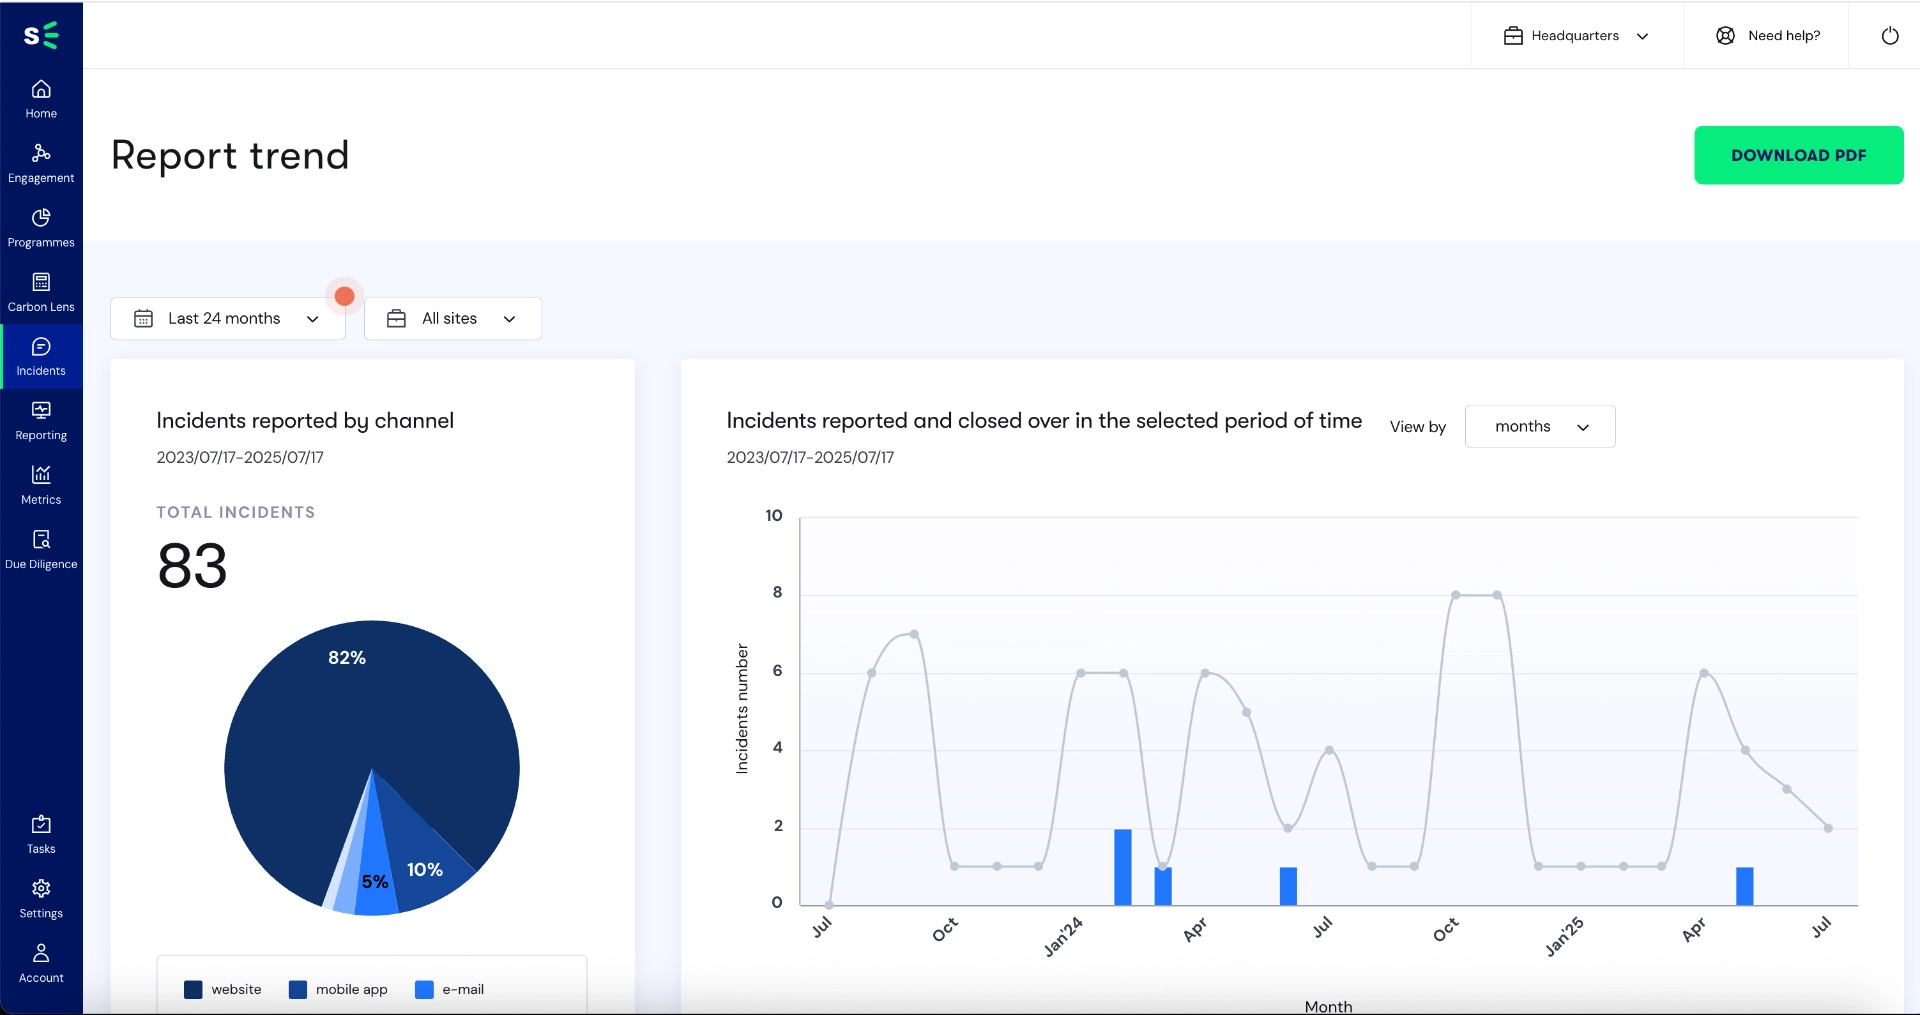
SEE REPORT TREND provides visual data analytics through graphs covering key metrics, including:
- Incidents reported by channel
- Incidents reported and closed over in the selected period of time
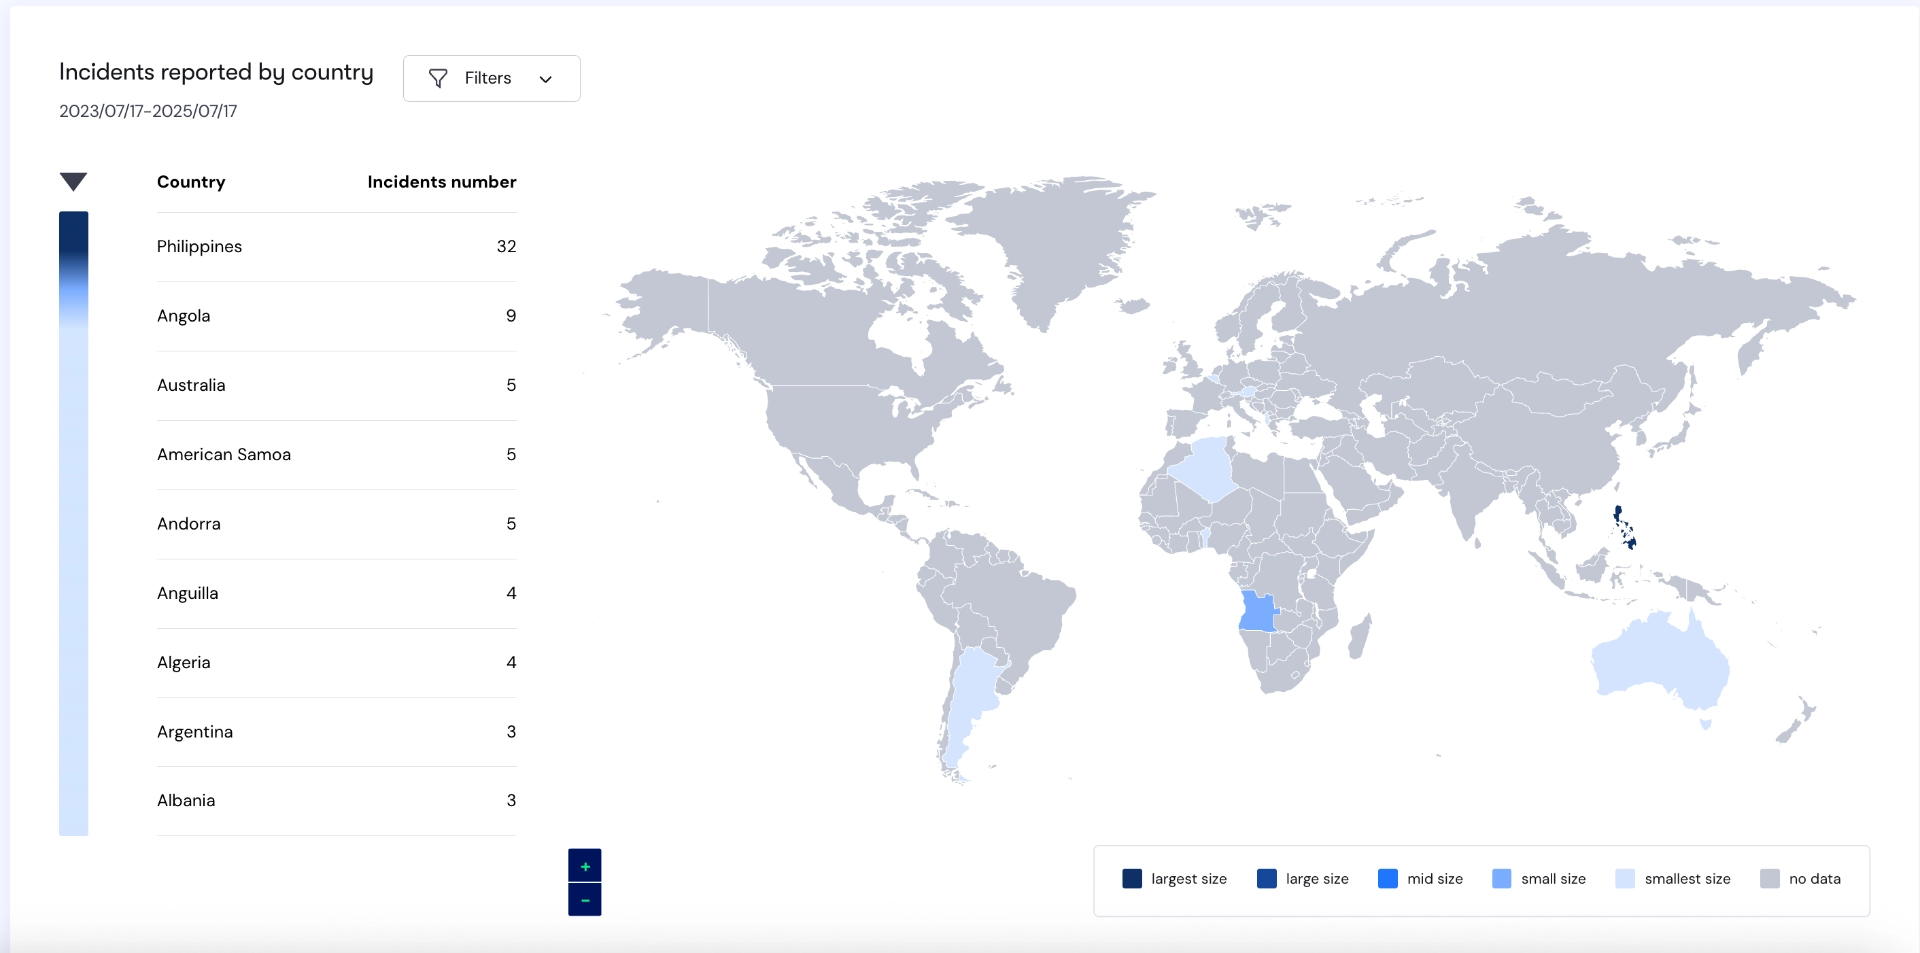
- Incidents reported by country
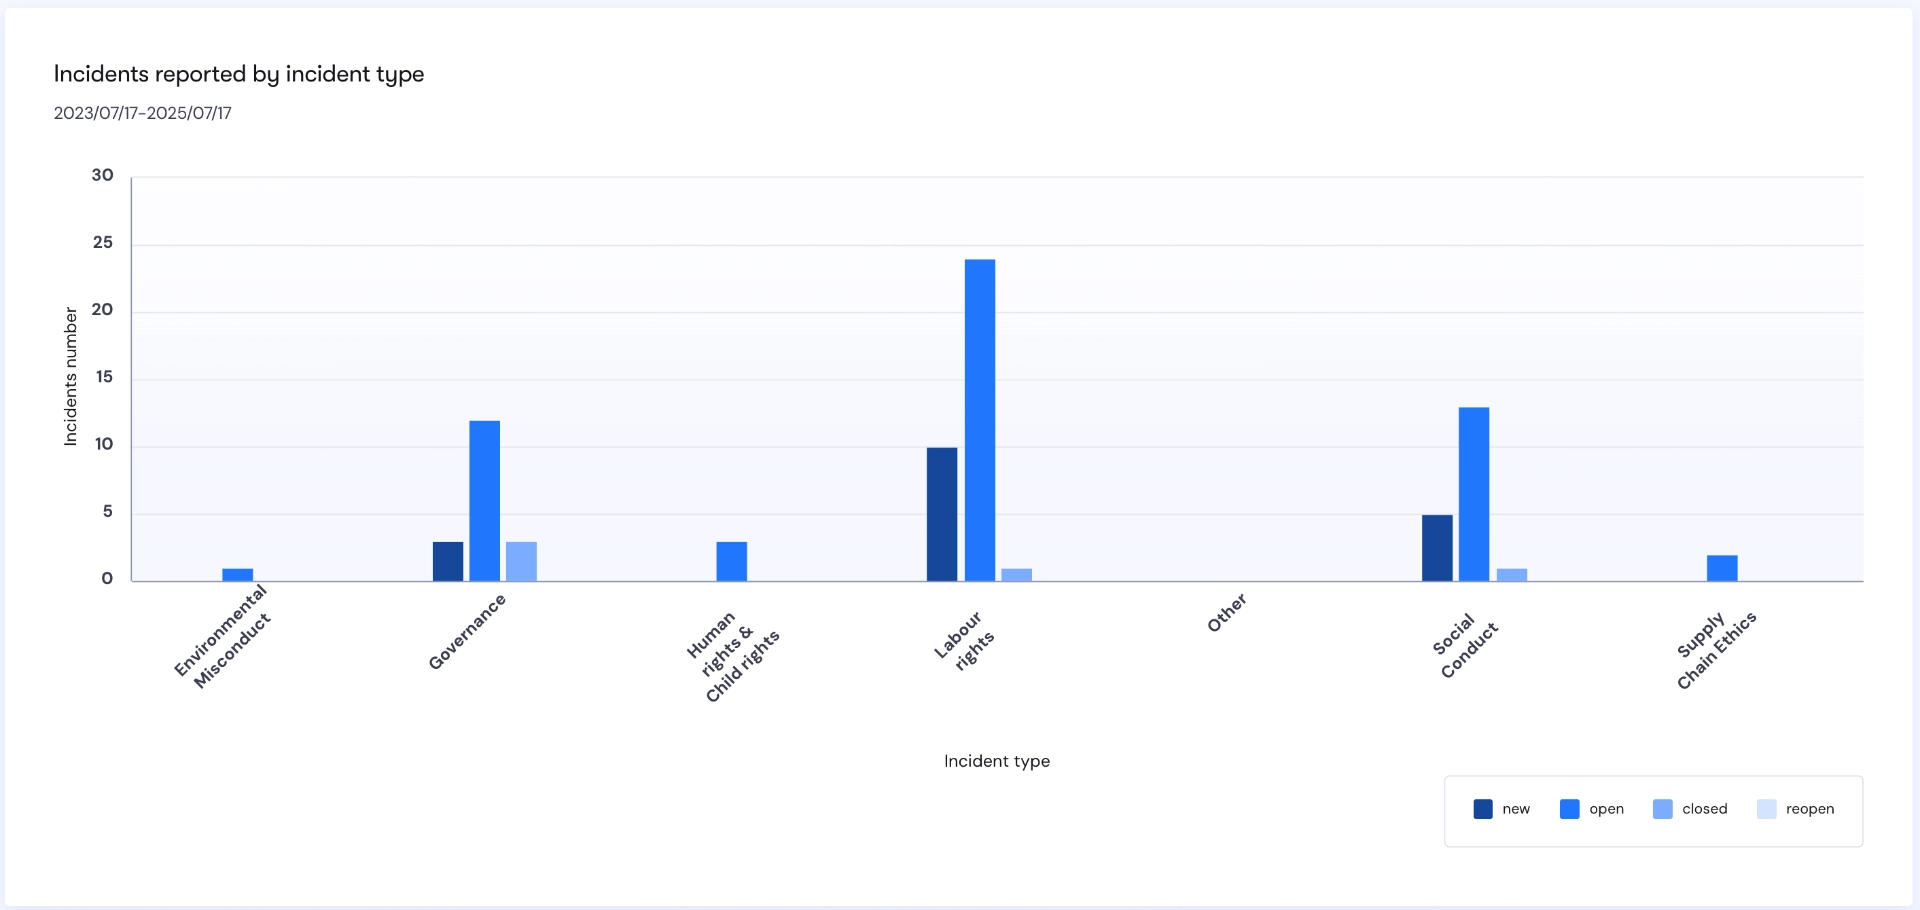
- Incidents reported by incident type
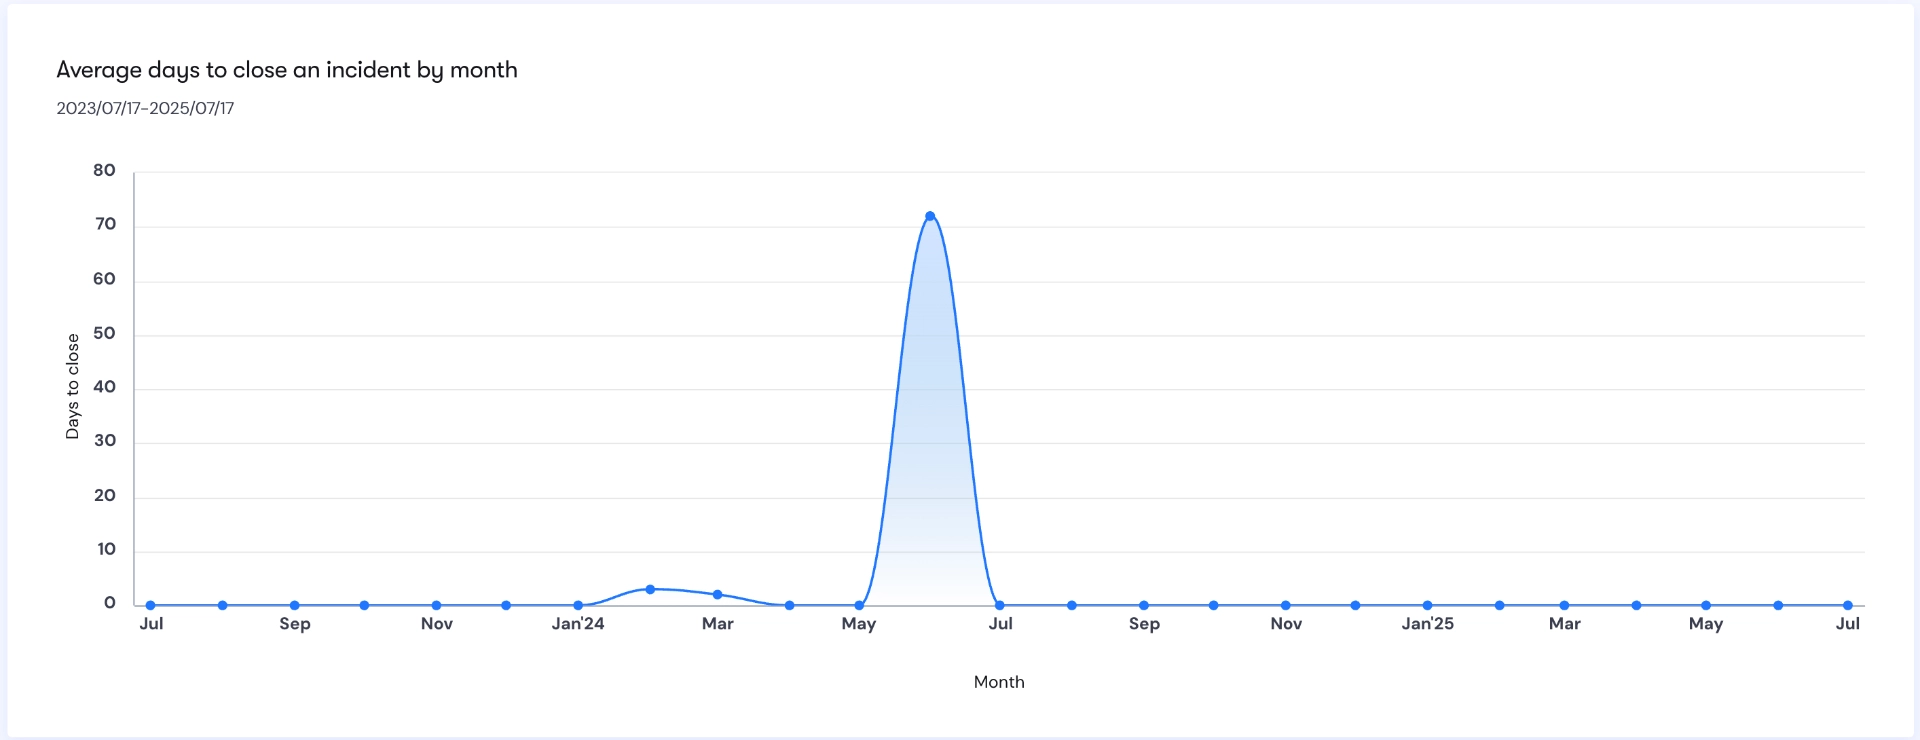
- Average days to close an incident by month
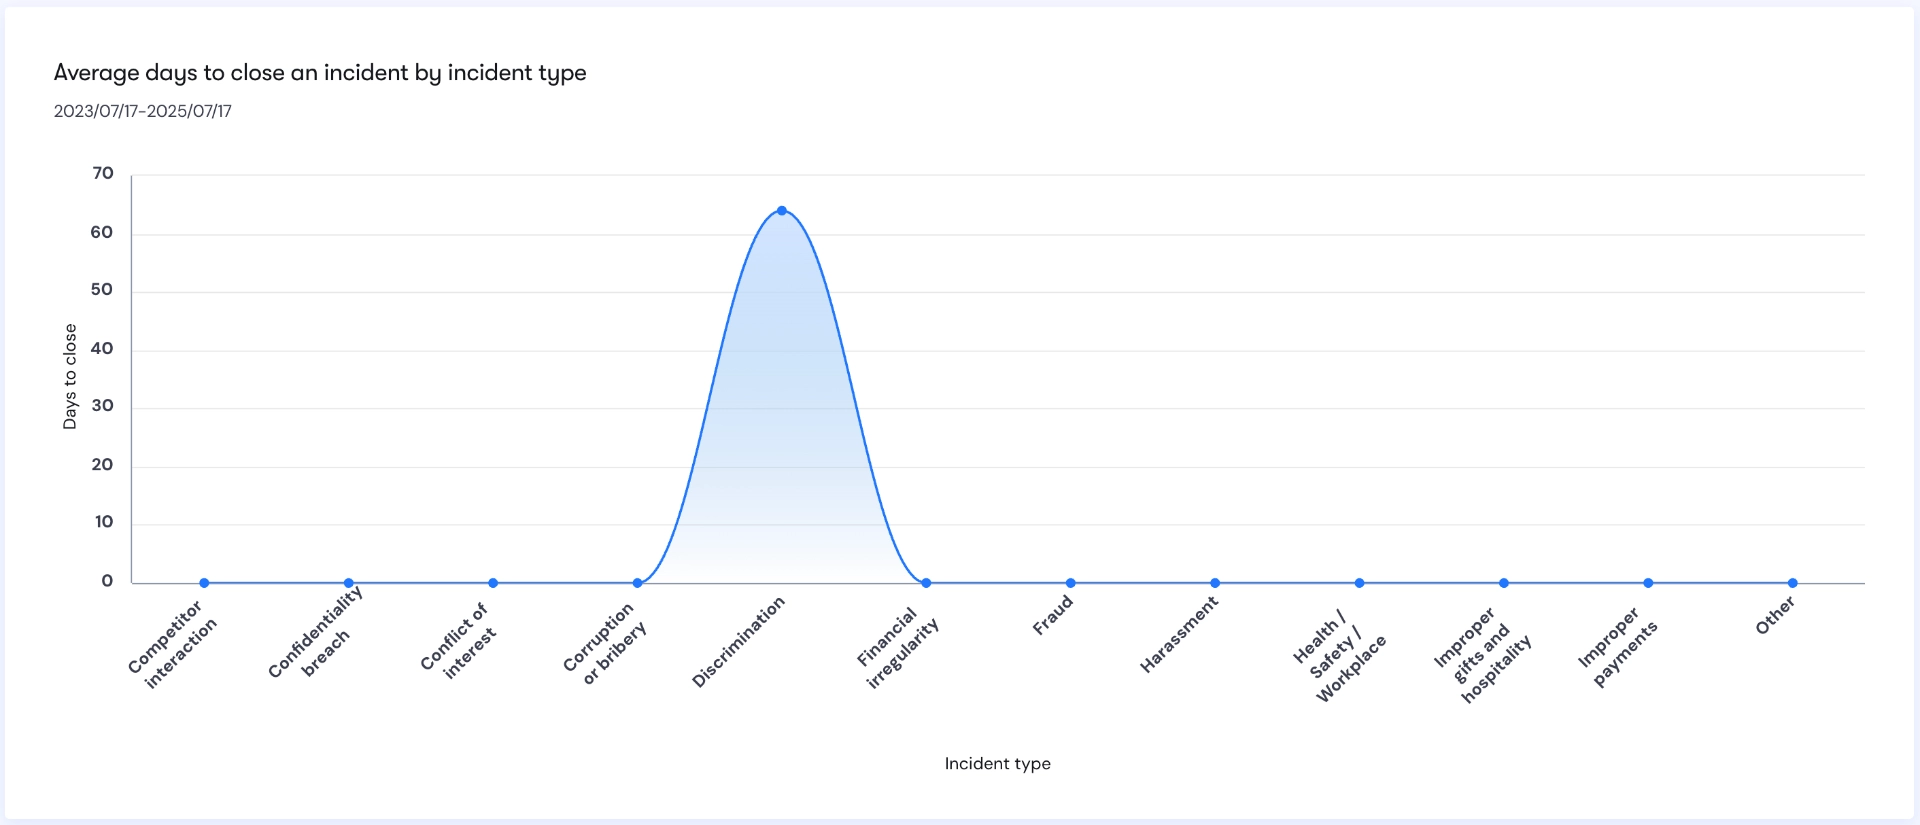
- Average days to close an incident by incident type
The data displayed is based on the date range selected in the filter. You also have the option to download a PDF version of the analytics report.
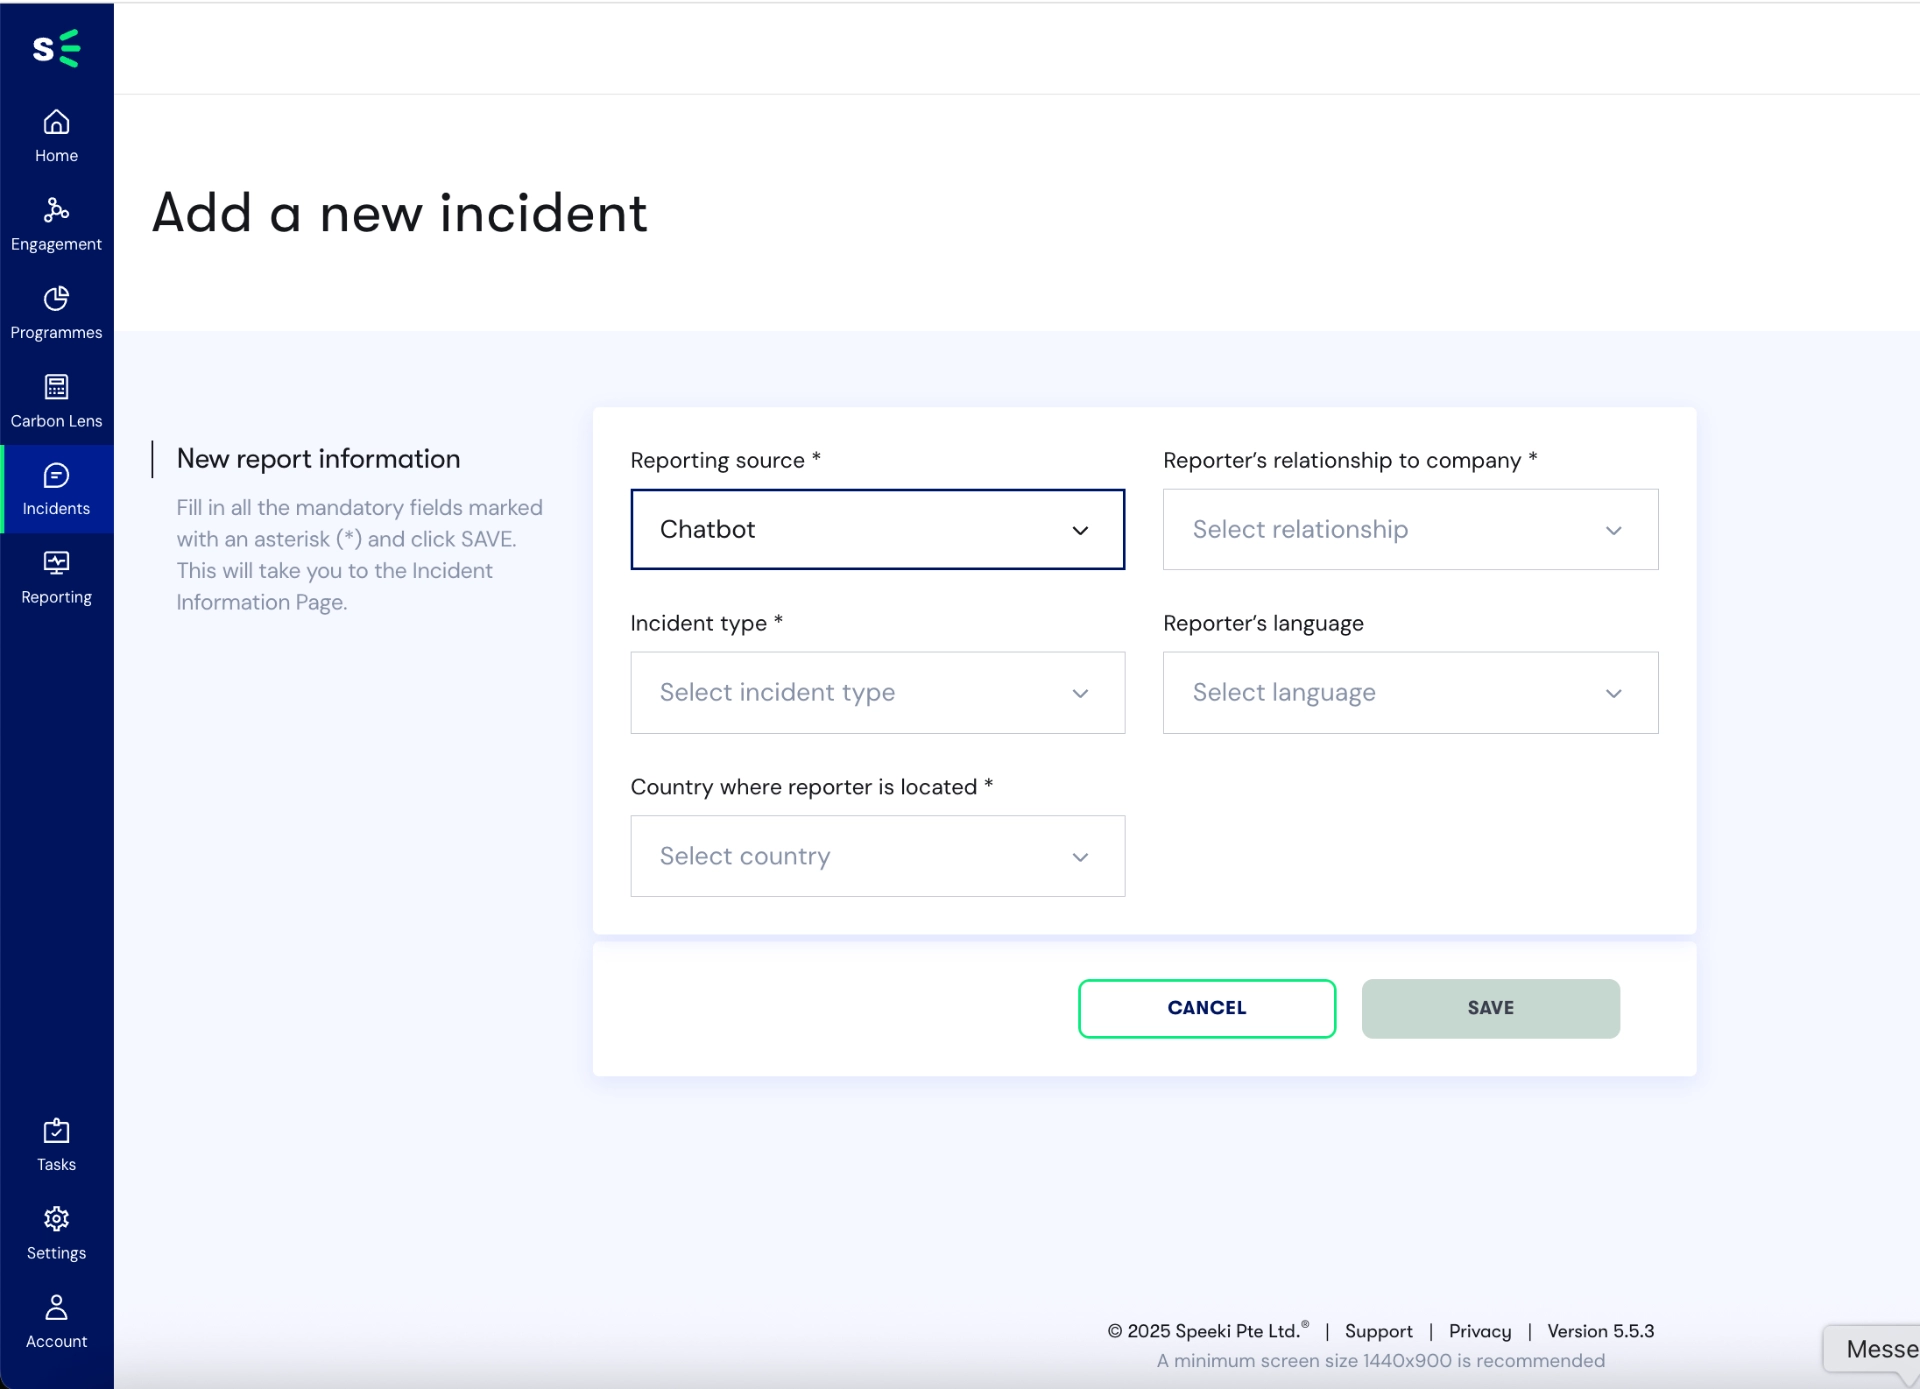
To add a new incident in Incidents, click the ADD NEW INCIDENT button.
You will be directed to the Add a New Incident page. Fill in all required fields (marked with *), then click SAVE to submit the incident.
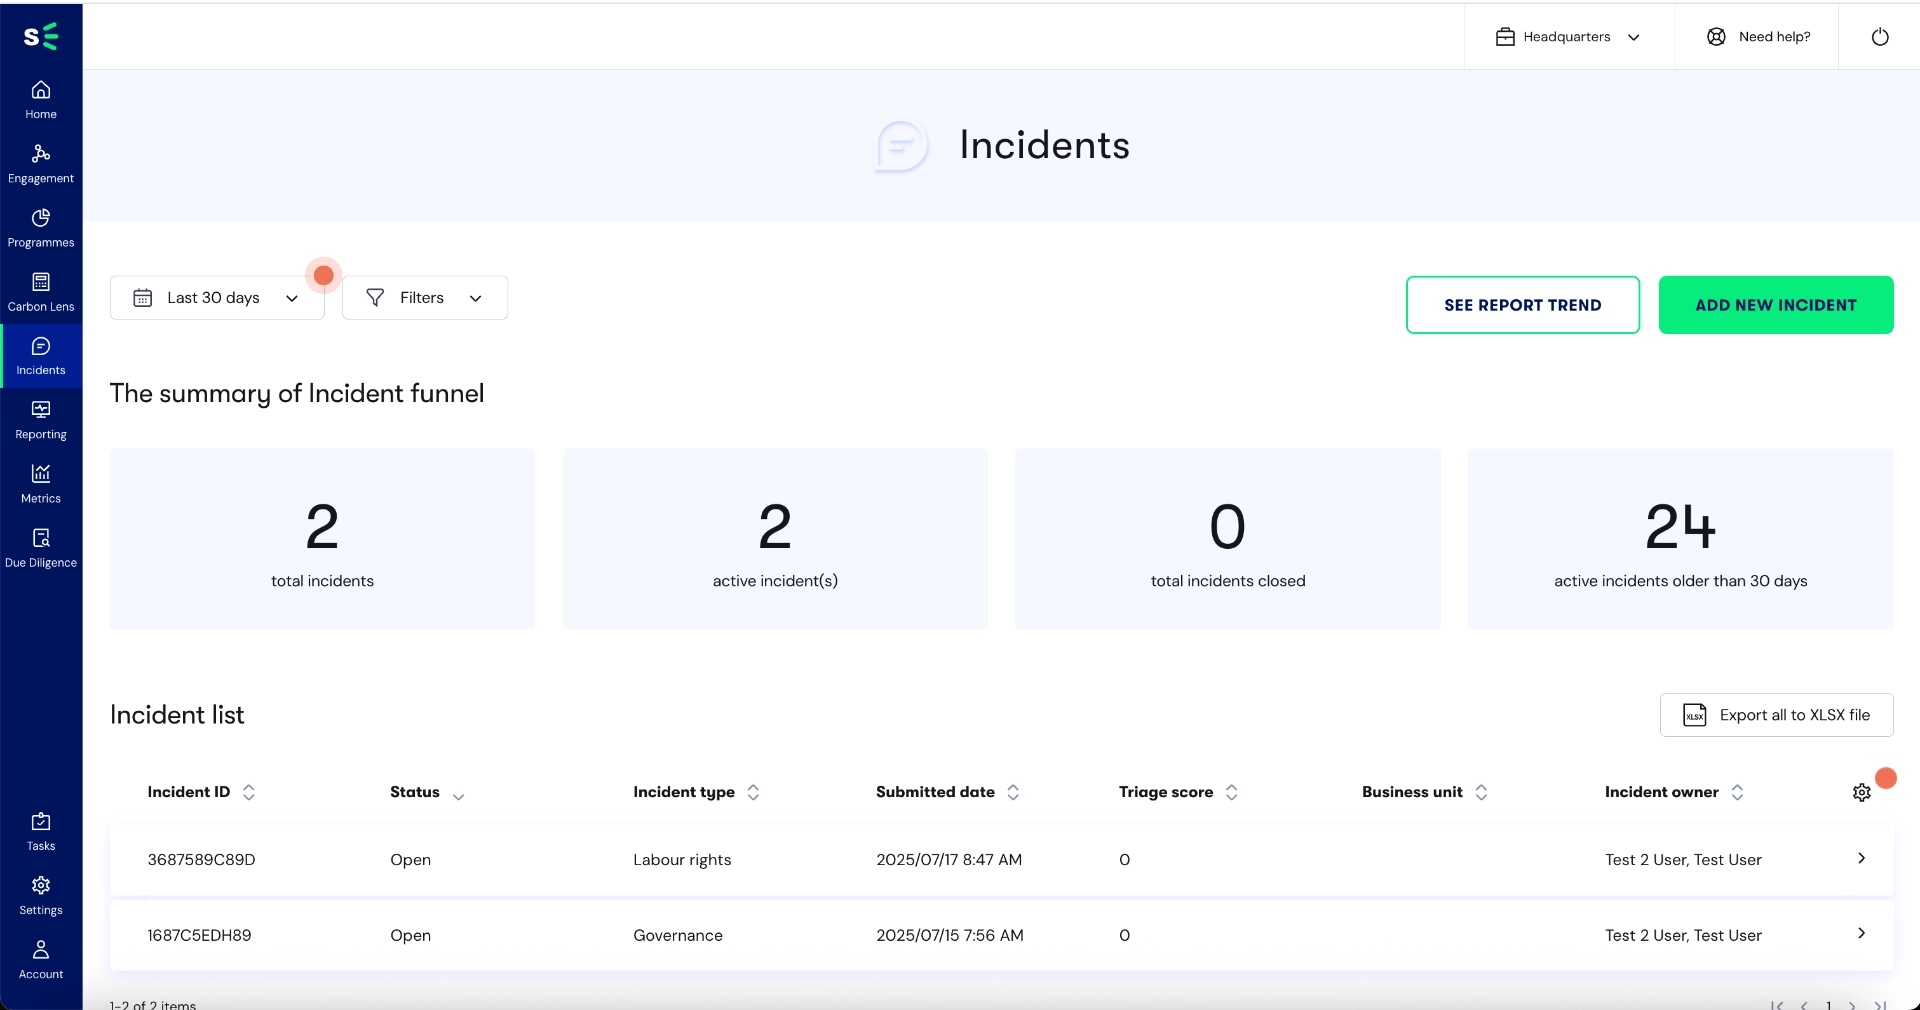
By default, the dashboard displays the following columns: Incident ID, Status, Source, Incident Type, Reporter Location, Submitted Date, and Origin Language.
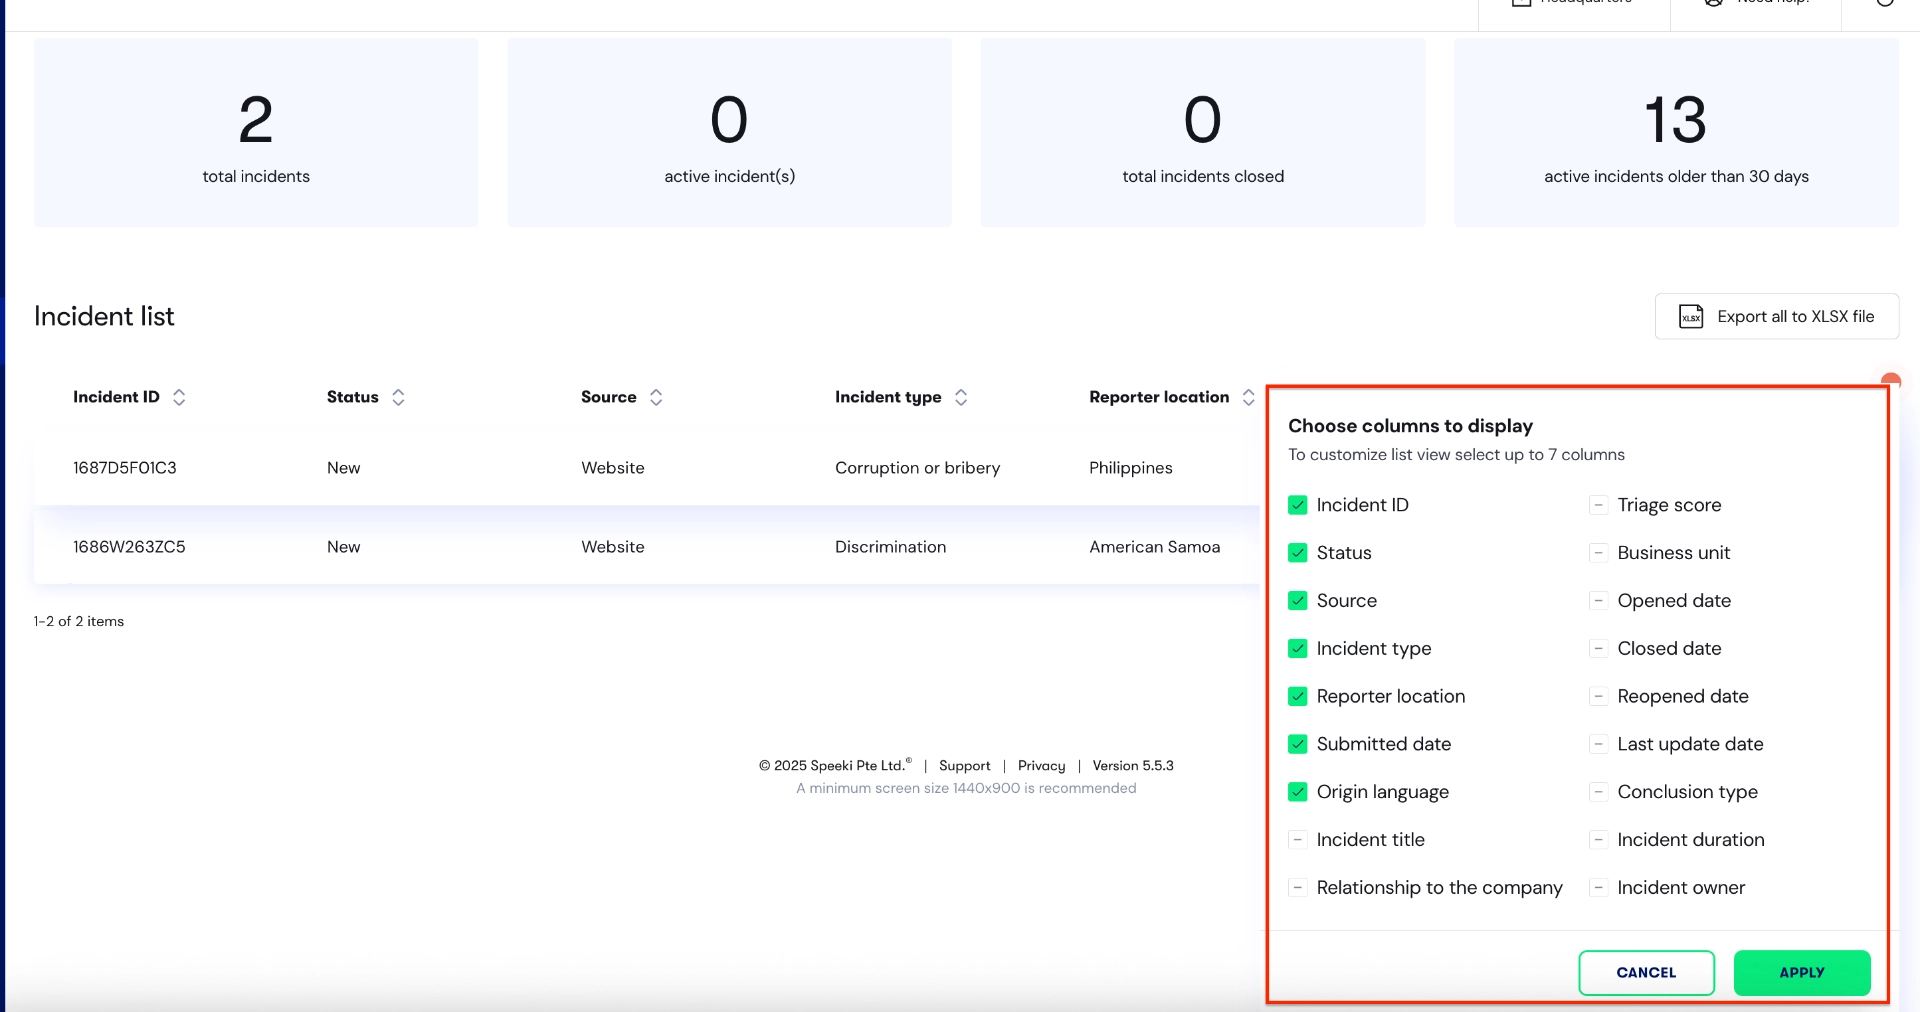
You can customize the displayed columns by clicking the settings (gear) icon and selecting from the available options. Please note that you can select up to 7 columns at a time.
This limit is not a system restriction, but a design consideration to ensure proper display on most laptop screens.
This is not a system limitation, but a security measure to protect sensitive information.