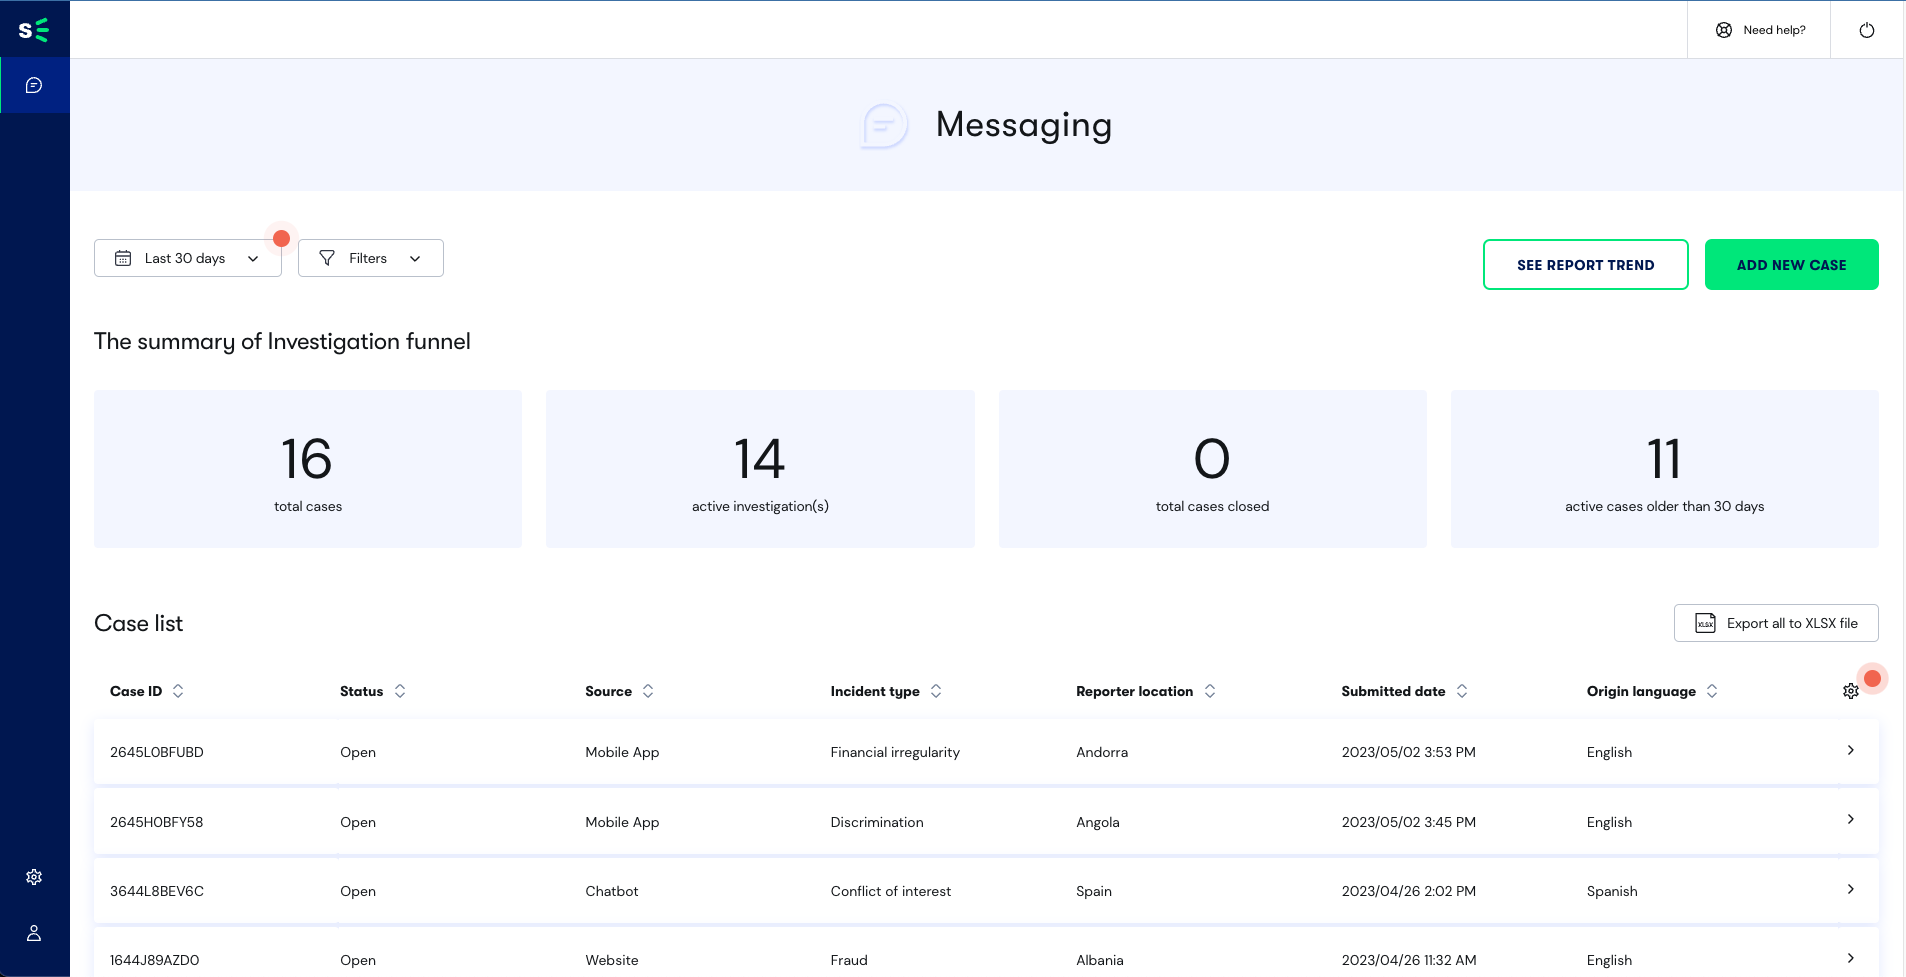
Incident Manager Dashboard and Report Trend
How do I navigate the Case Manager Dashboard?
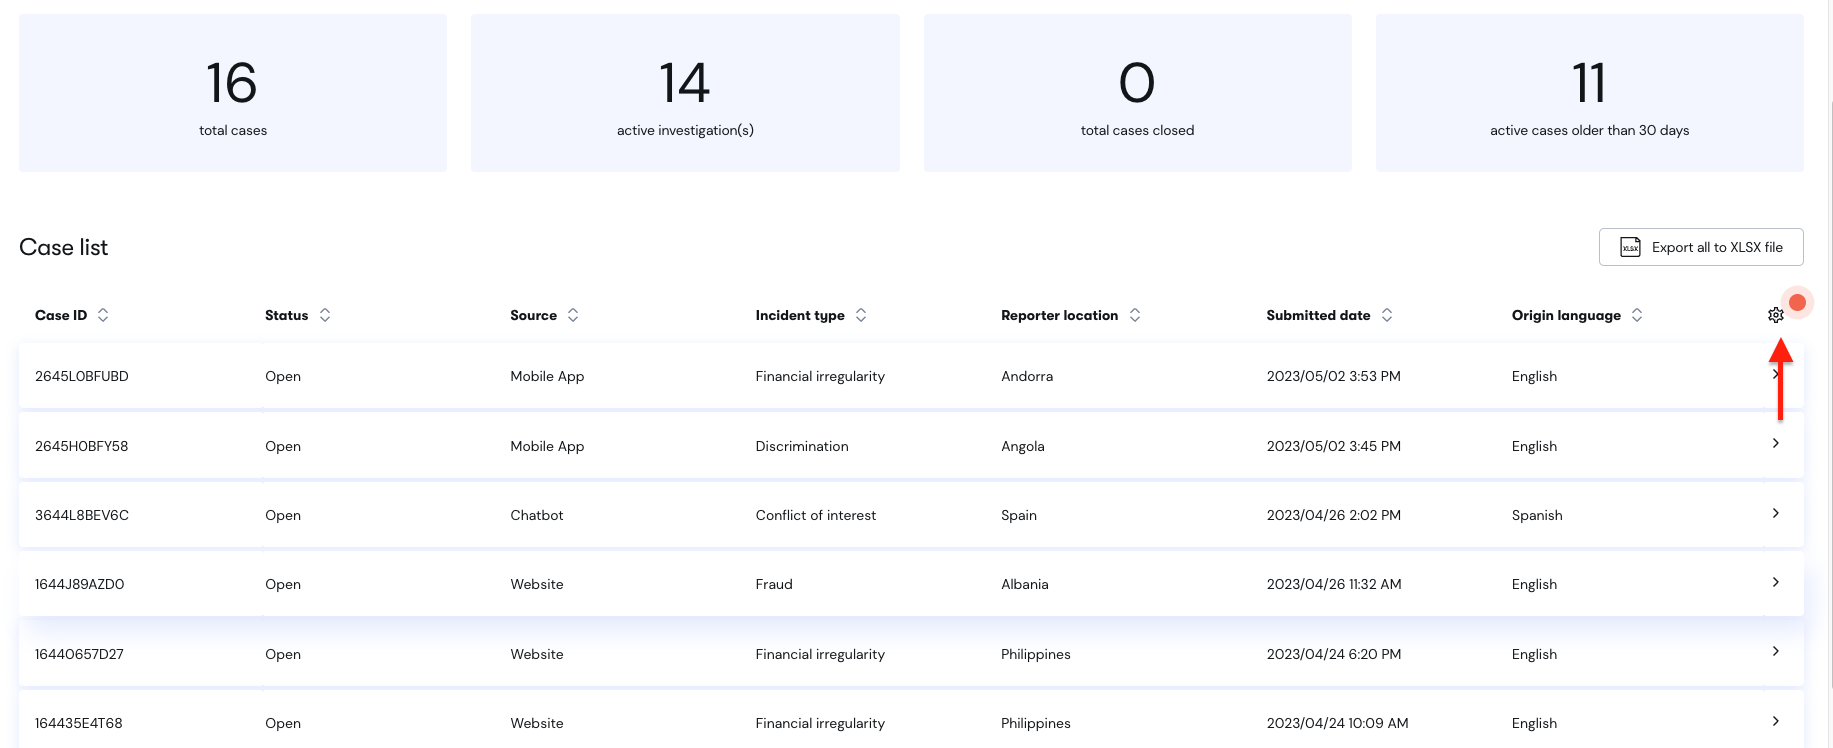
The dashboard displays all reports. (depending on your access level)
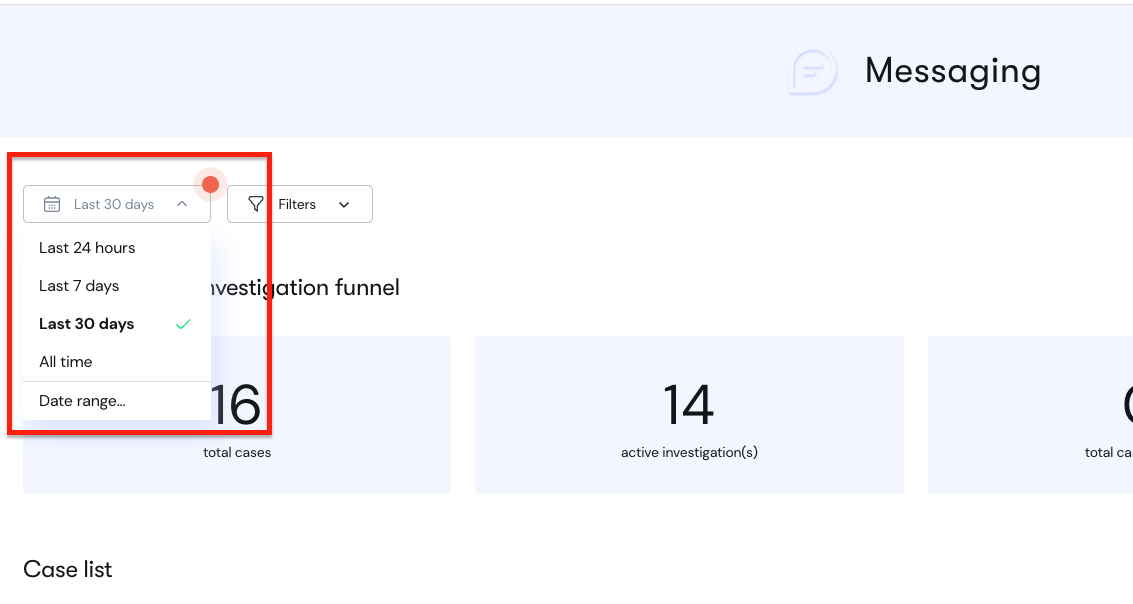
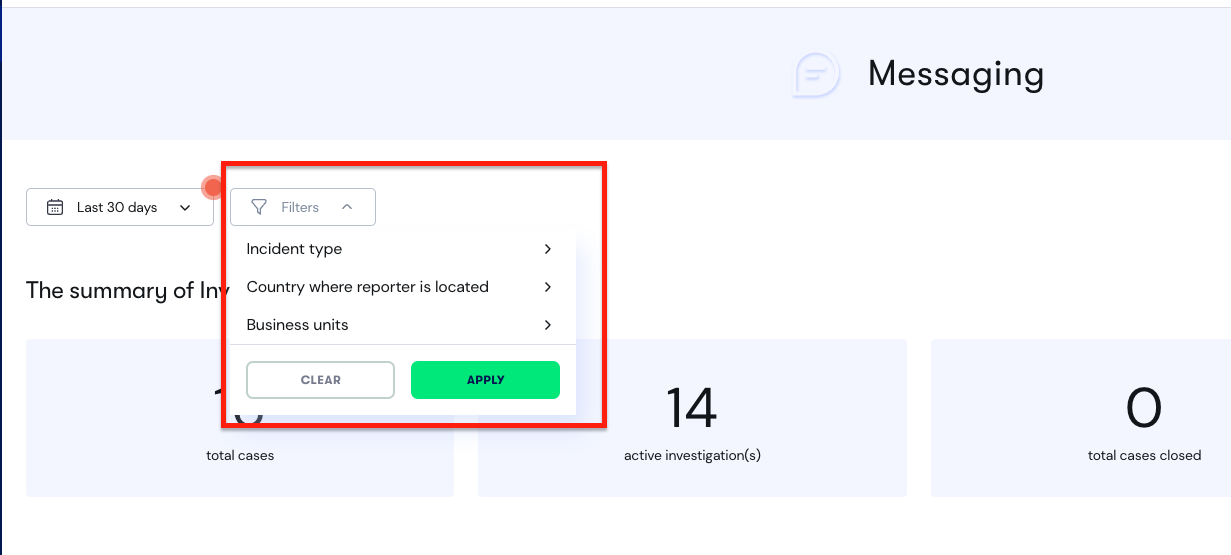
You can choose a date range to view reports or filter on Incident type, Reporter country or Business Unit.
On the right corner above the 'The summary of Investigation funnel', you will see SEE REPORT TREND and ADD NEW CASE button.
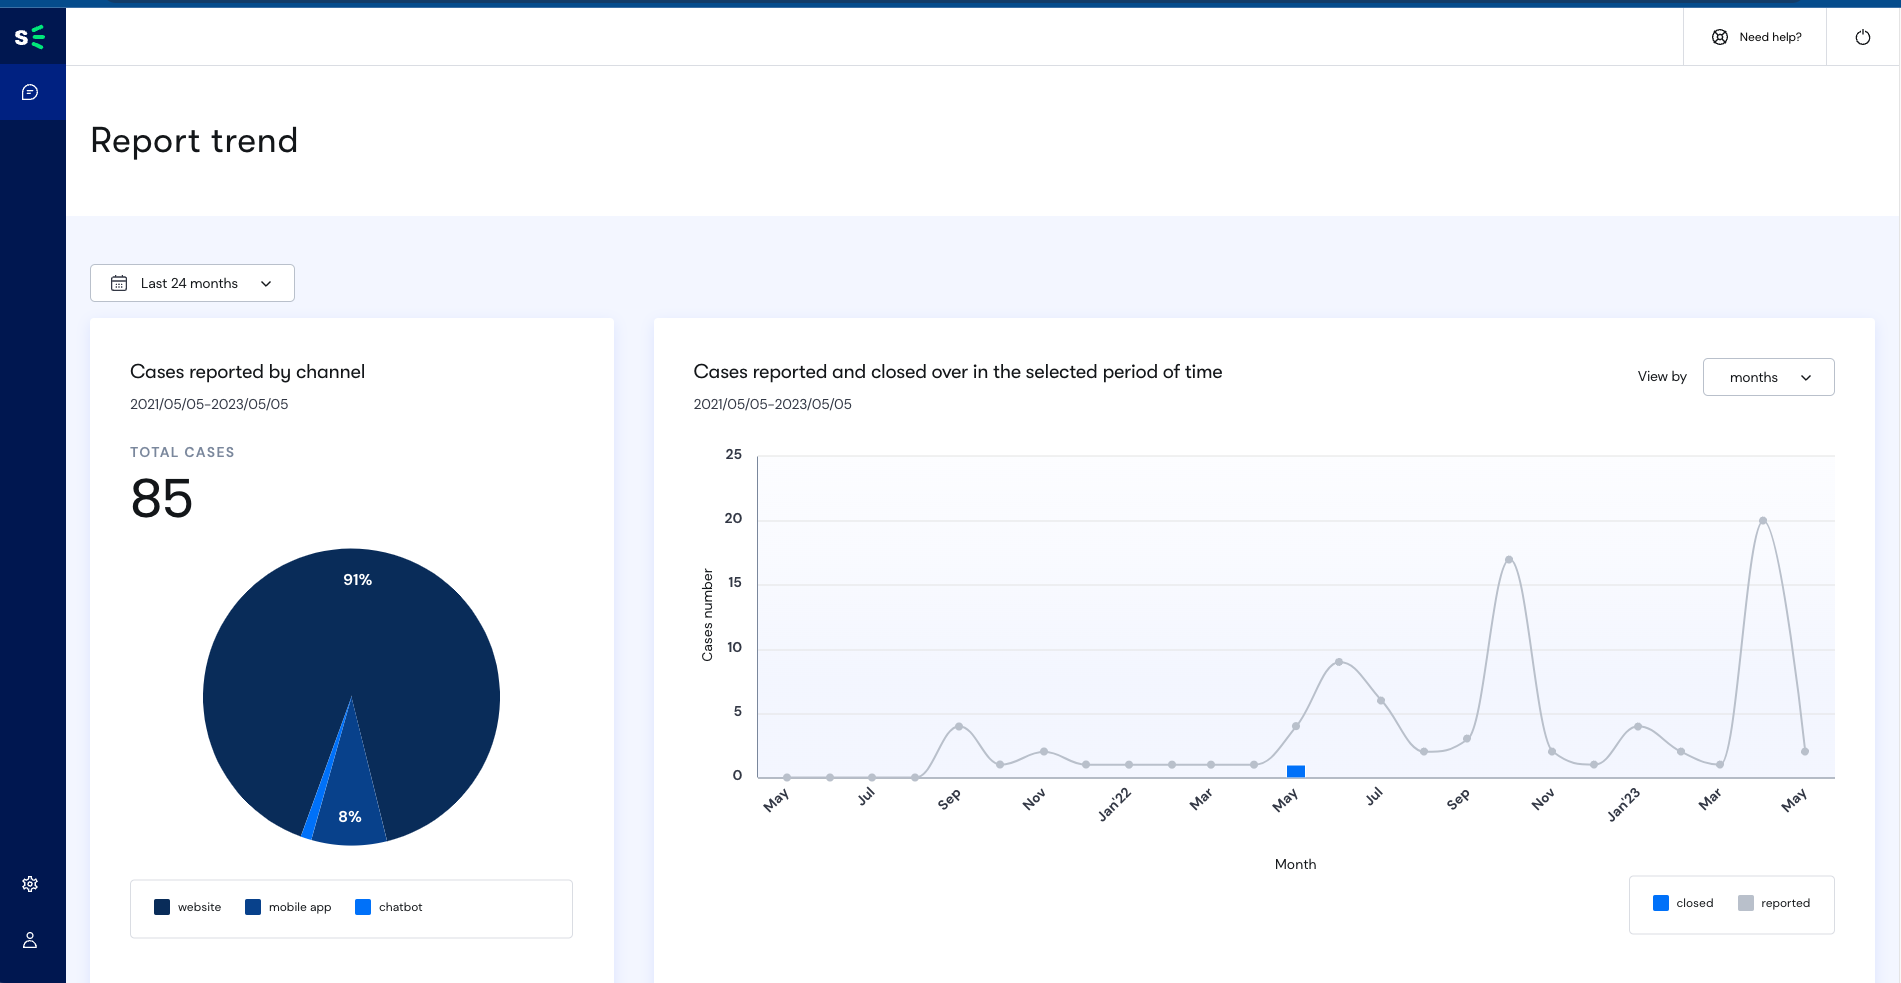
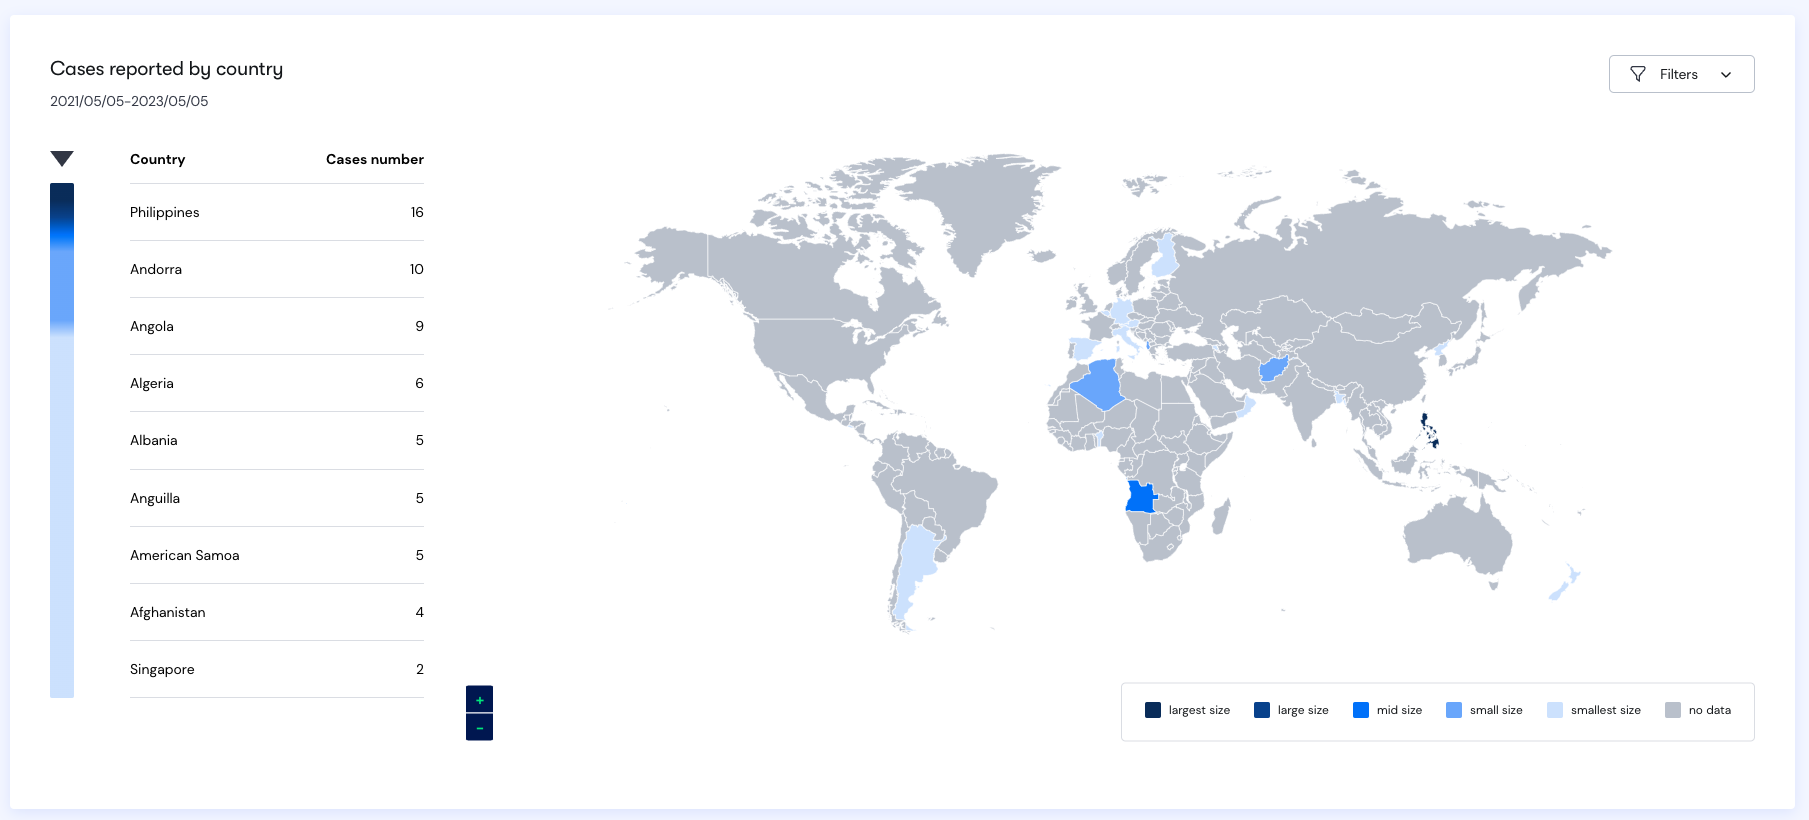
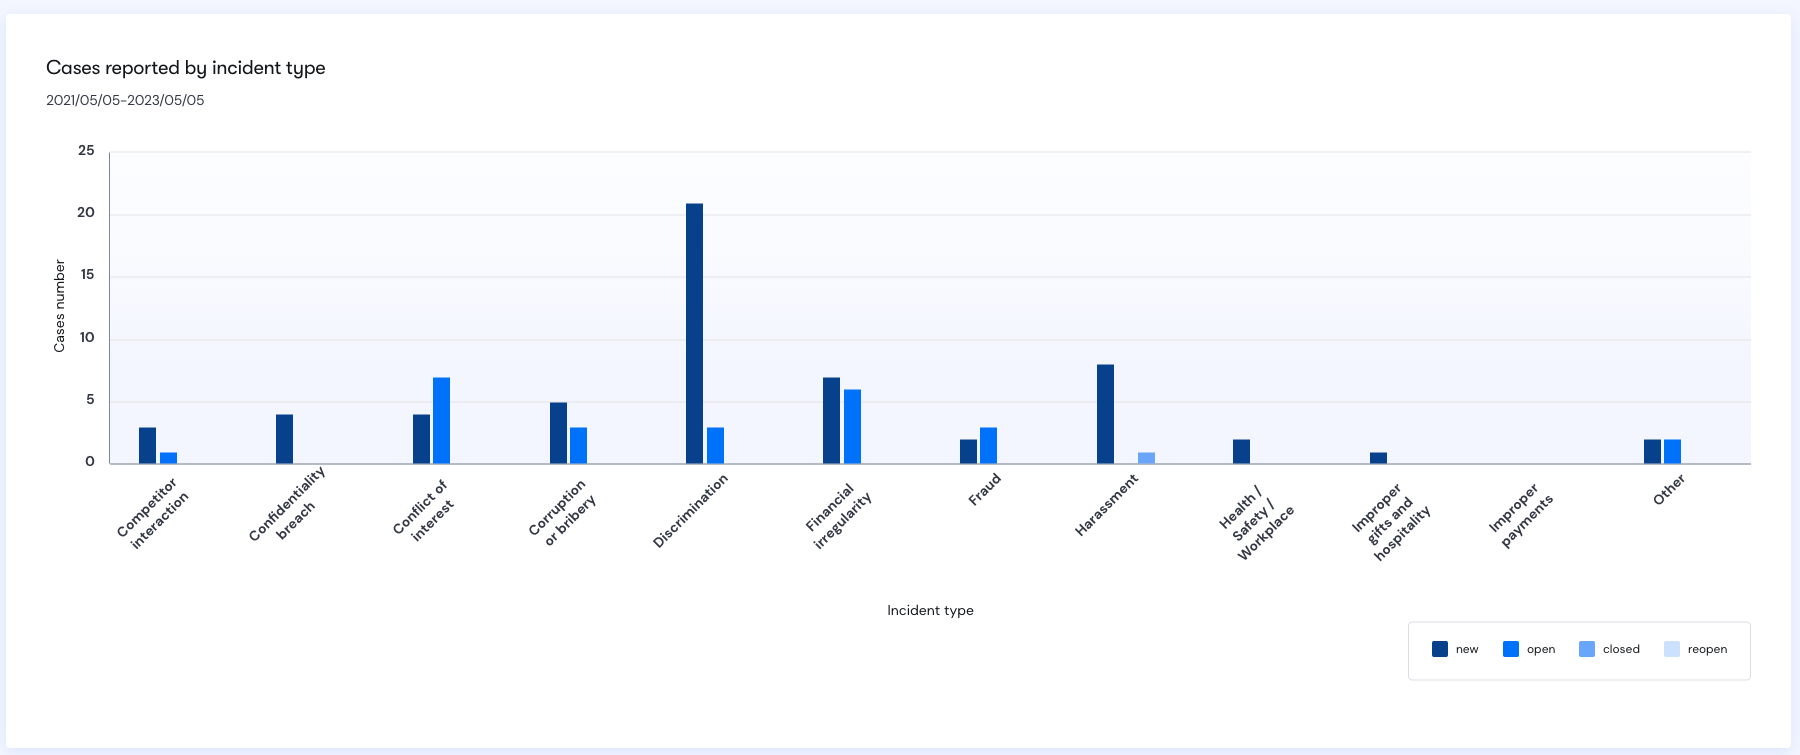
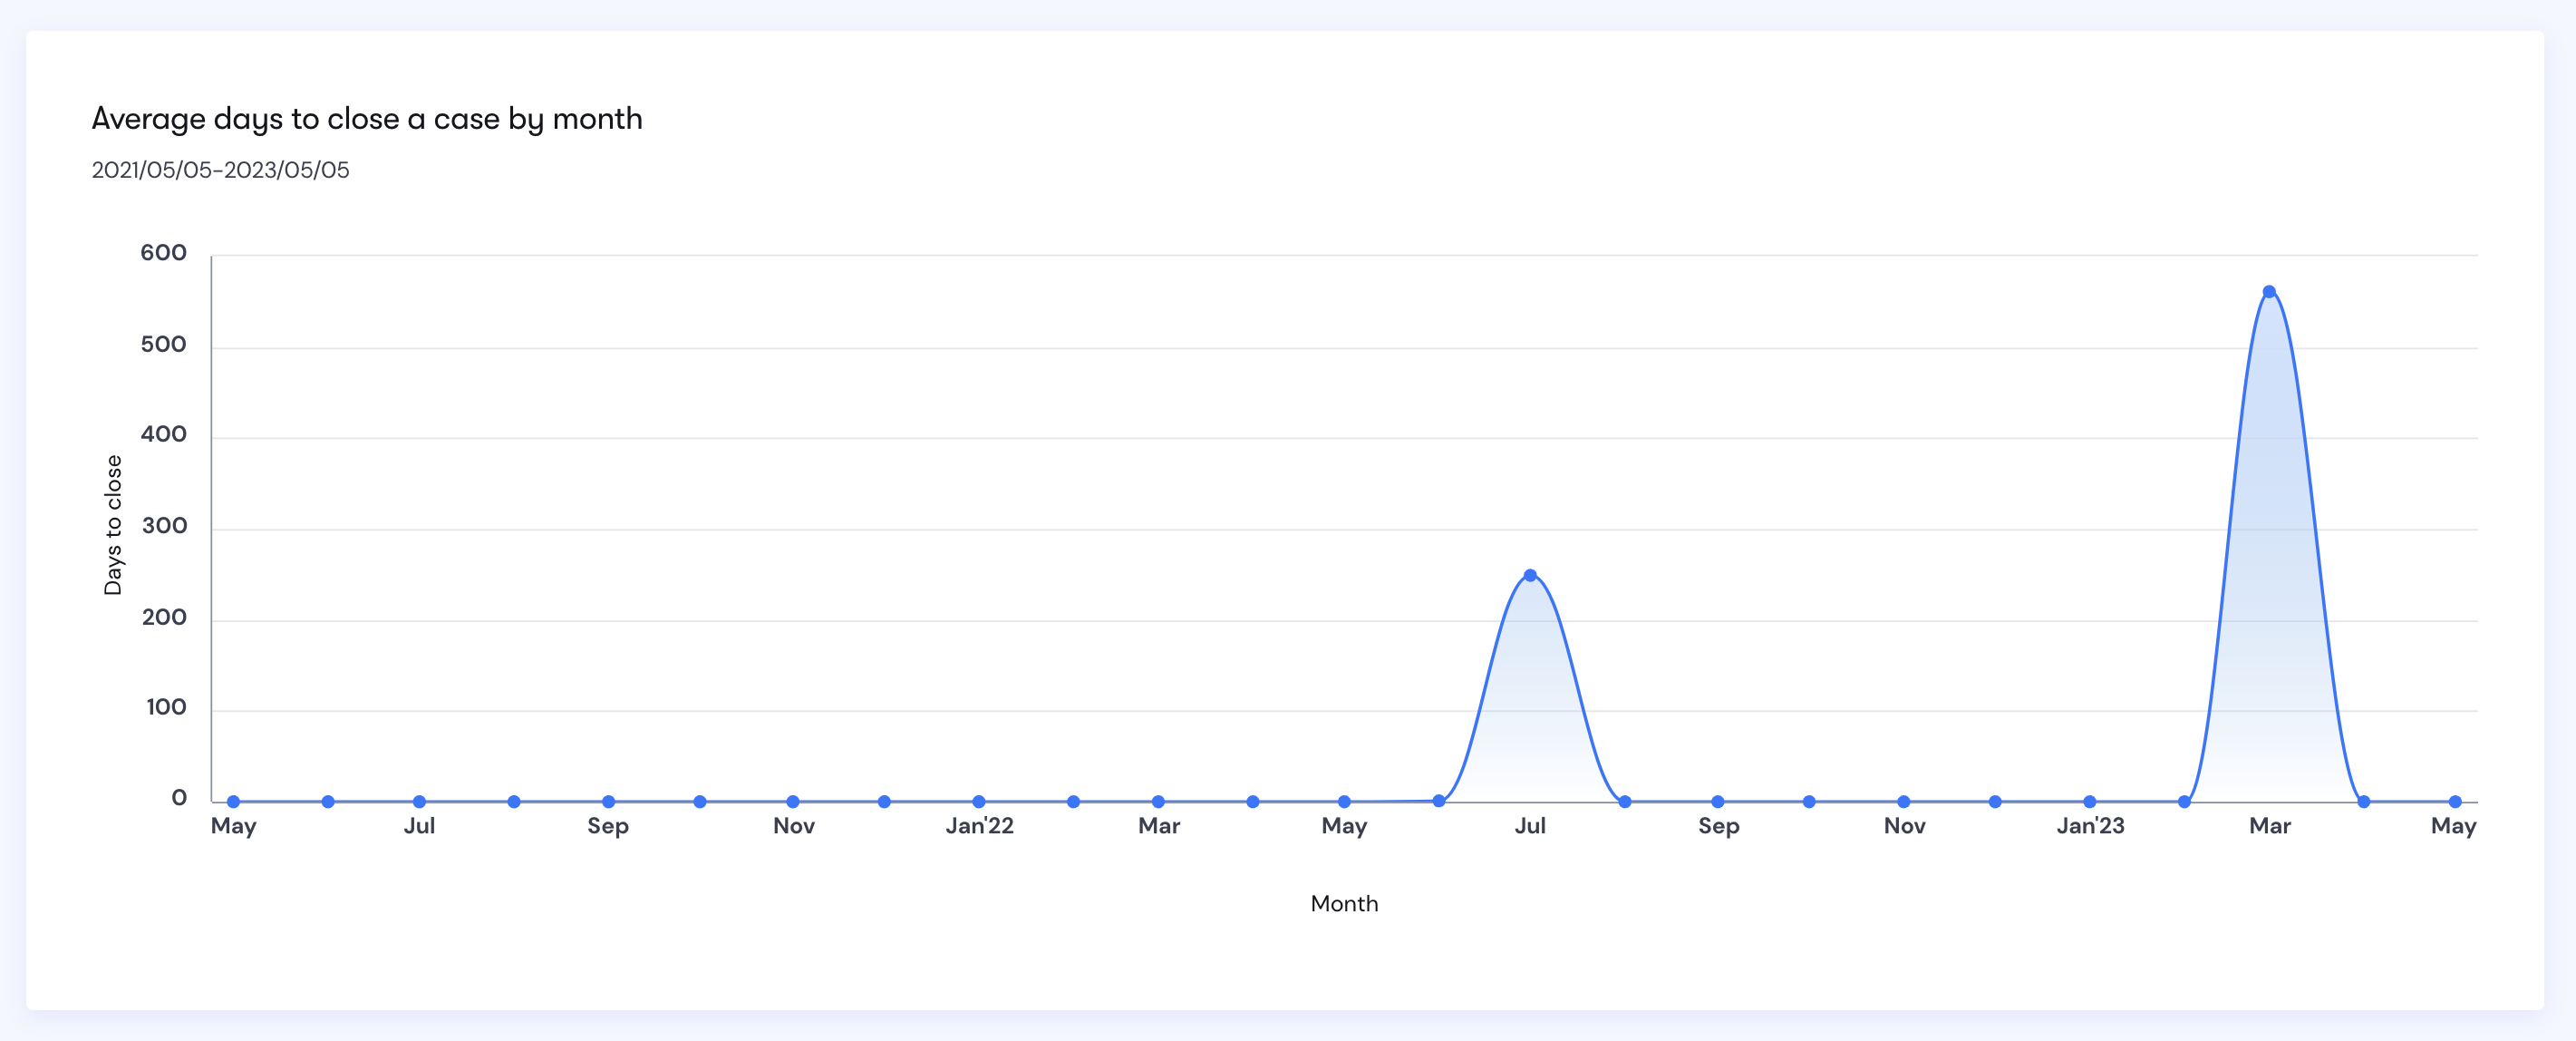
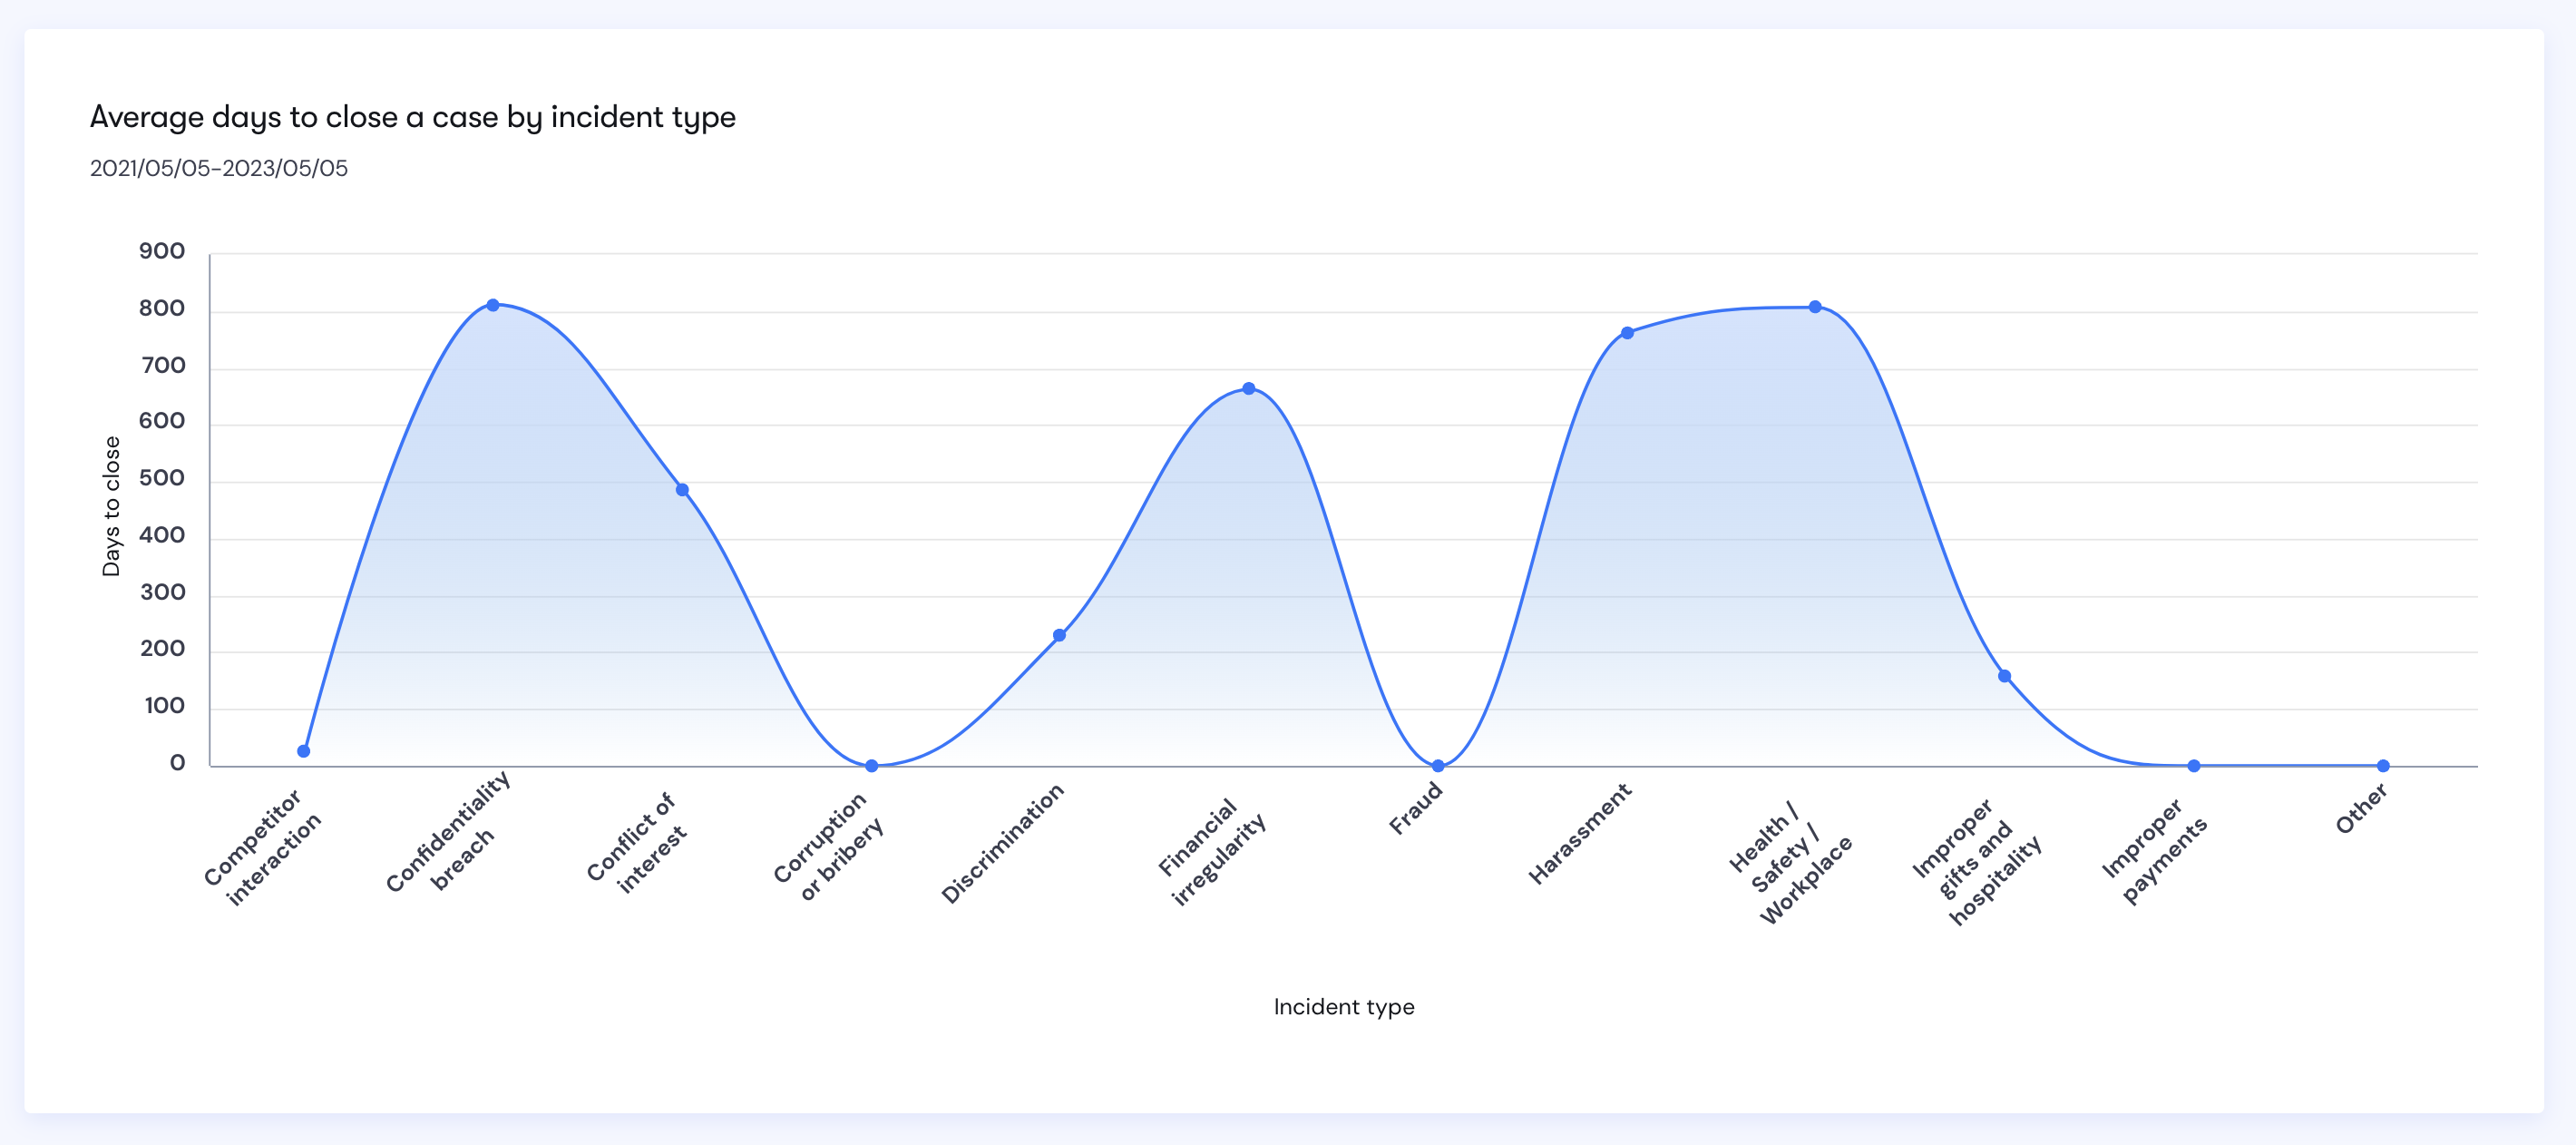
SEE REPORT TREND will show you data analytics using graphs for the reported cases by Cases reported by channel, Cases reported and closed over in the selected period of time, Cases reported by country, Cases reported by incident type, Average days to close a case by month and Average days to close a case by incident type based on the date range you selected on the filter.
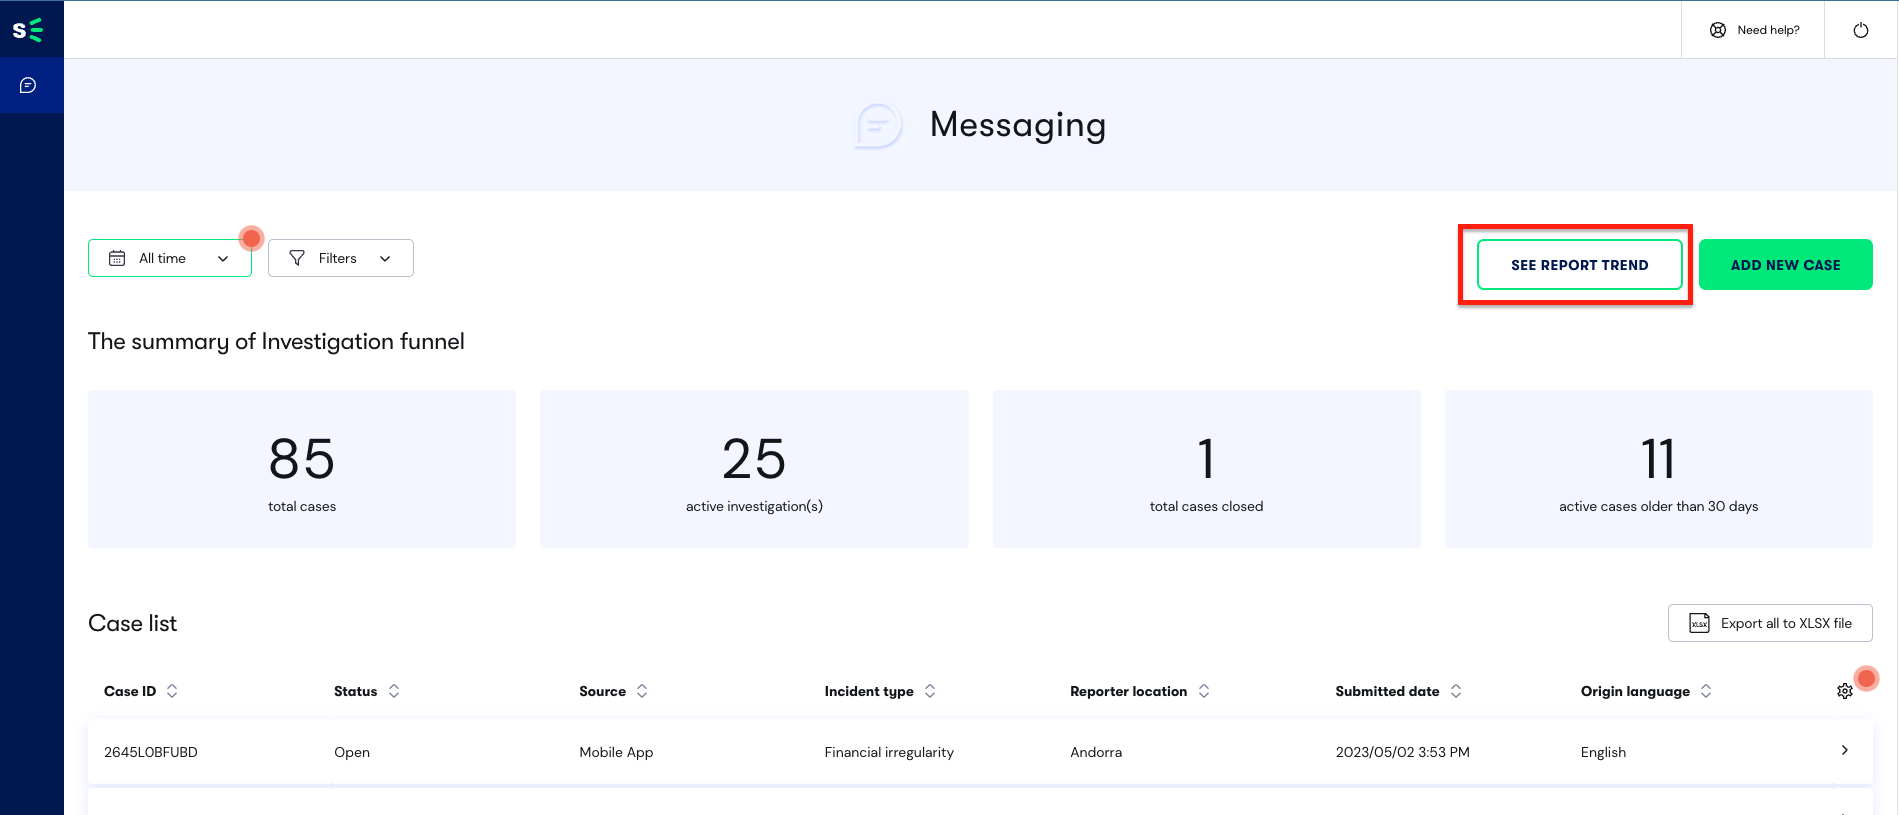
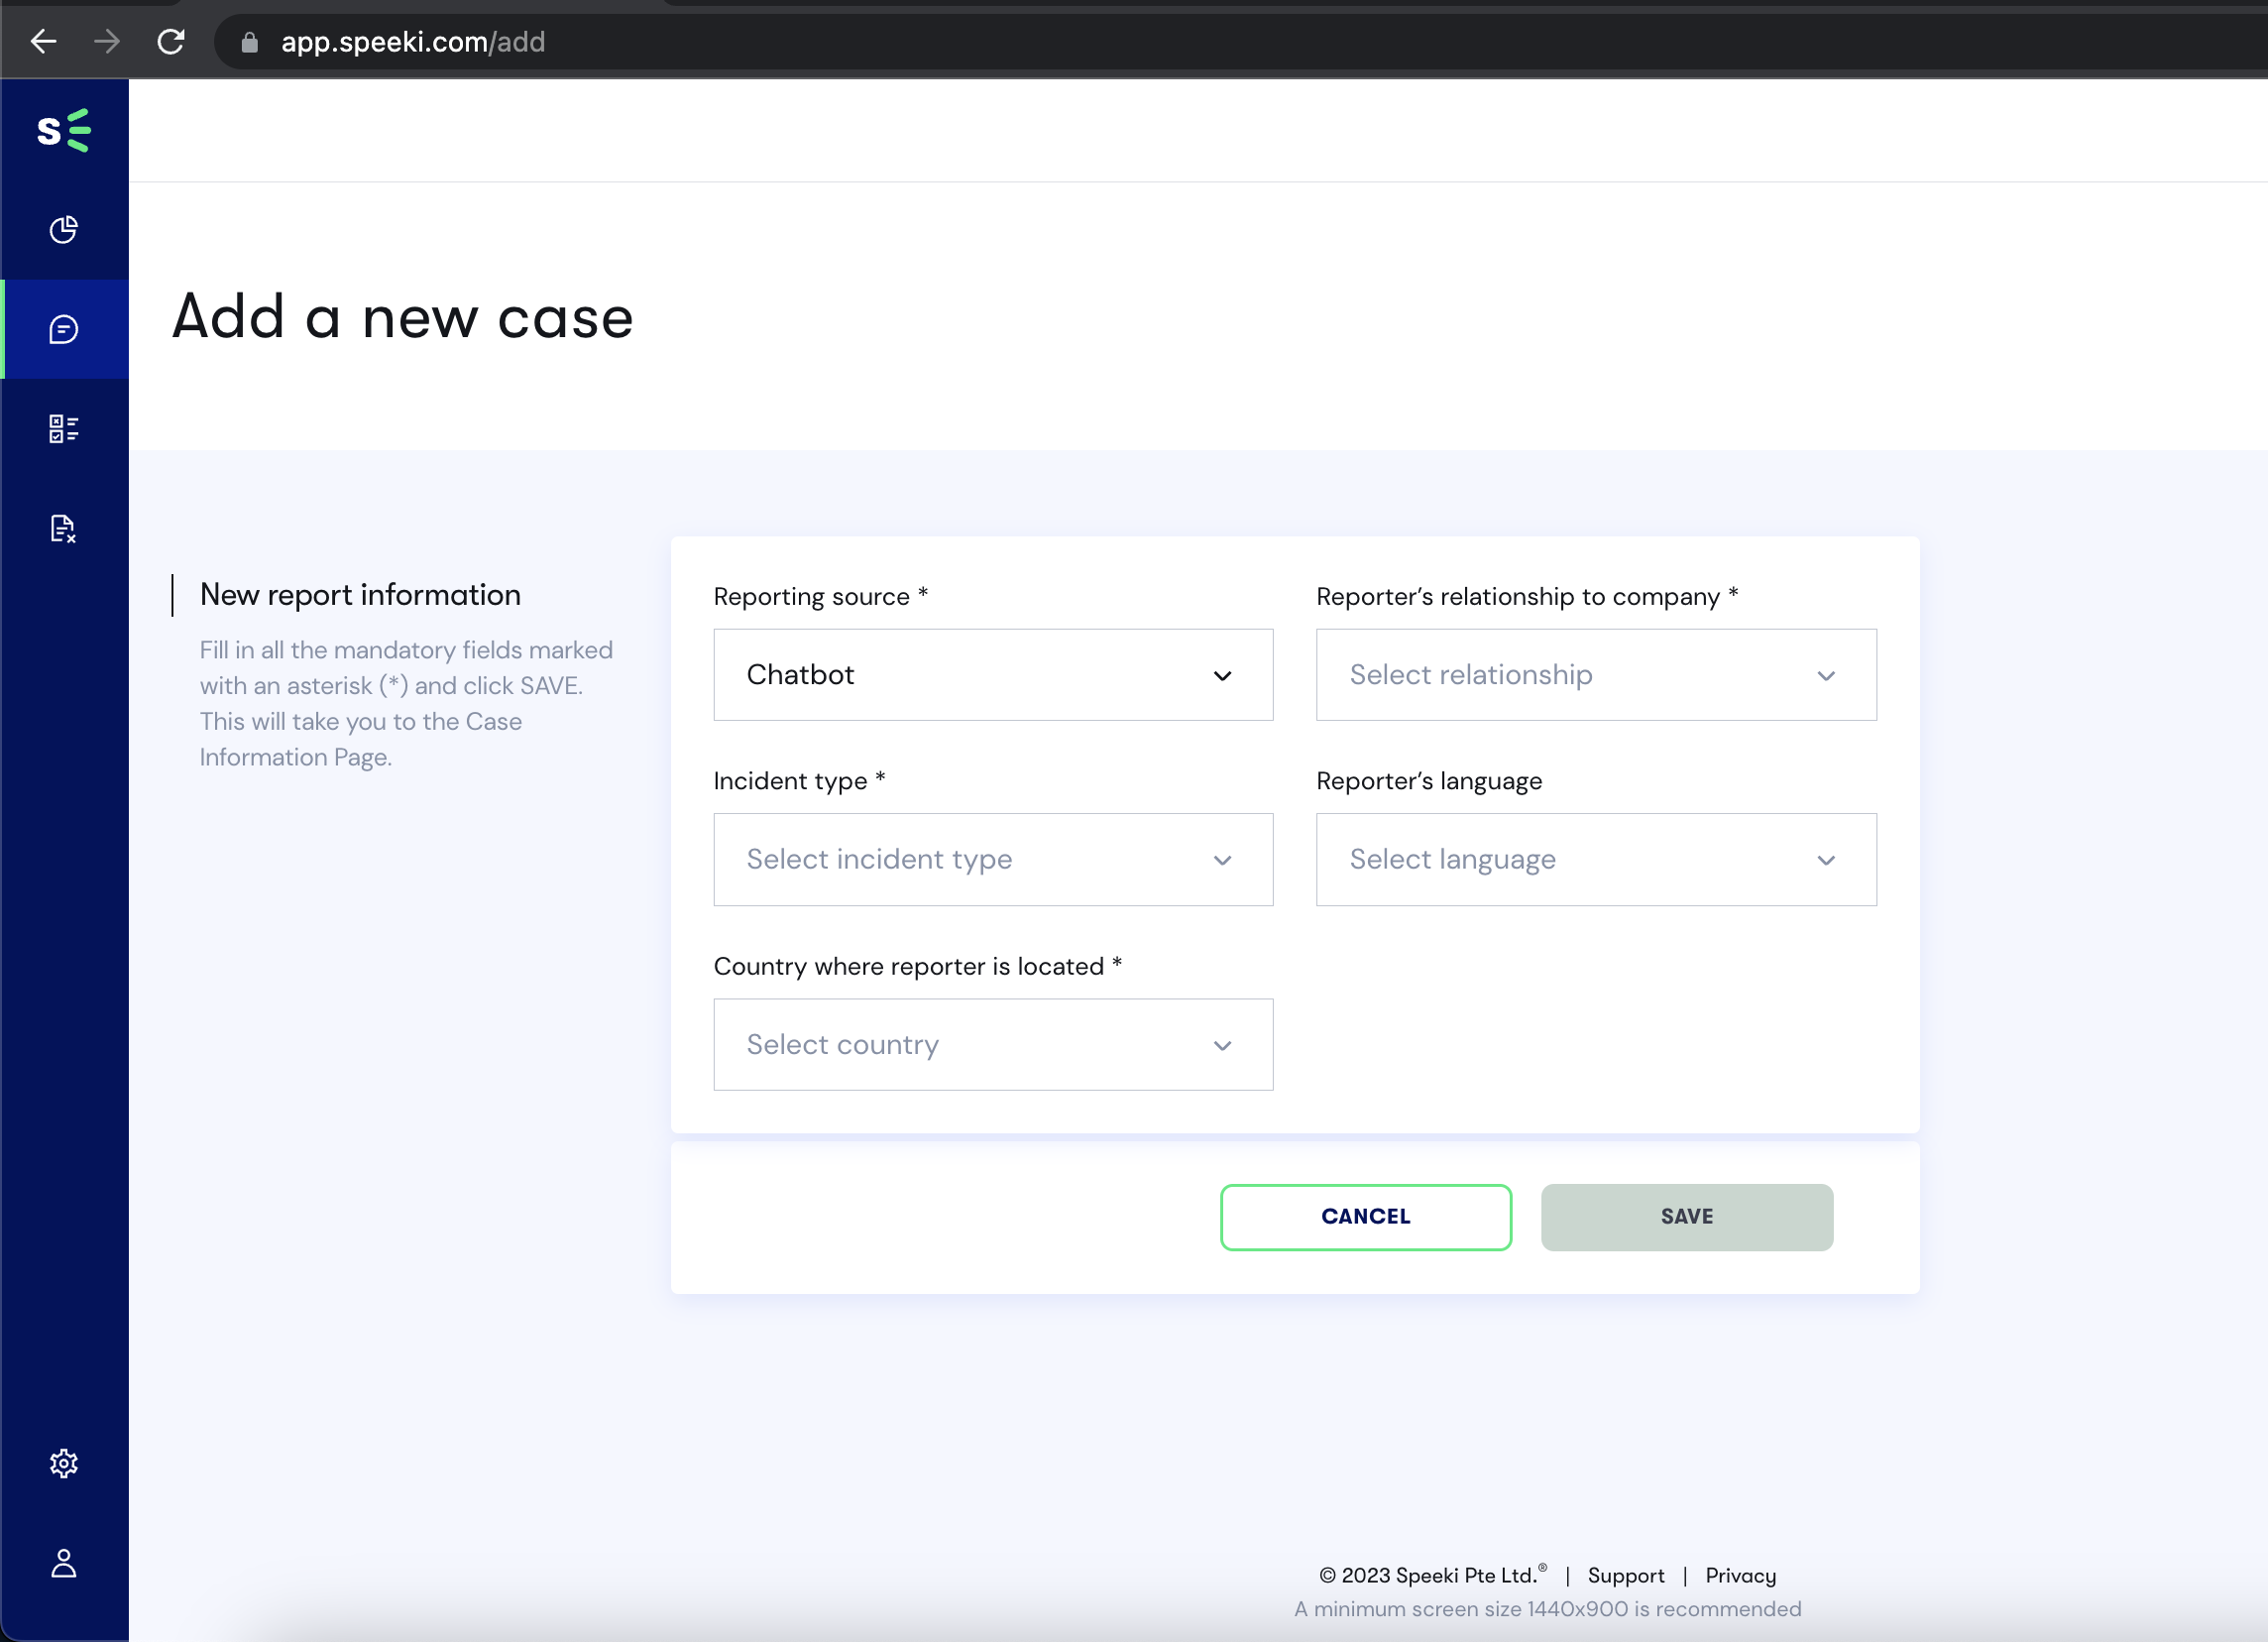
If you want to add a new case in Case Manager, click ADD NEW CASE button and it will bring you to the Add a new case page. Input required fields (*) then click SAVE.
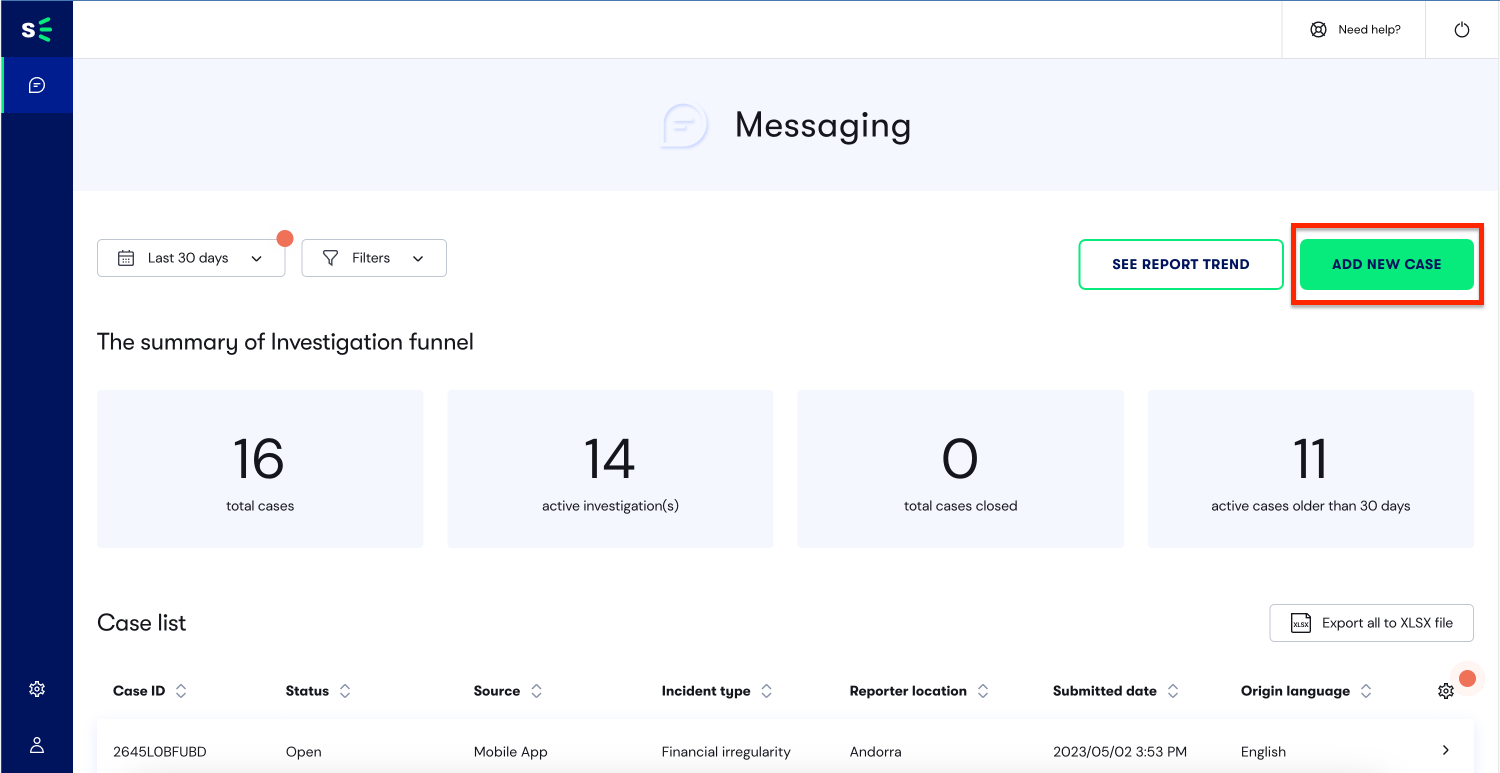
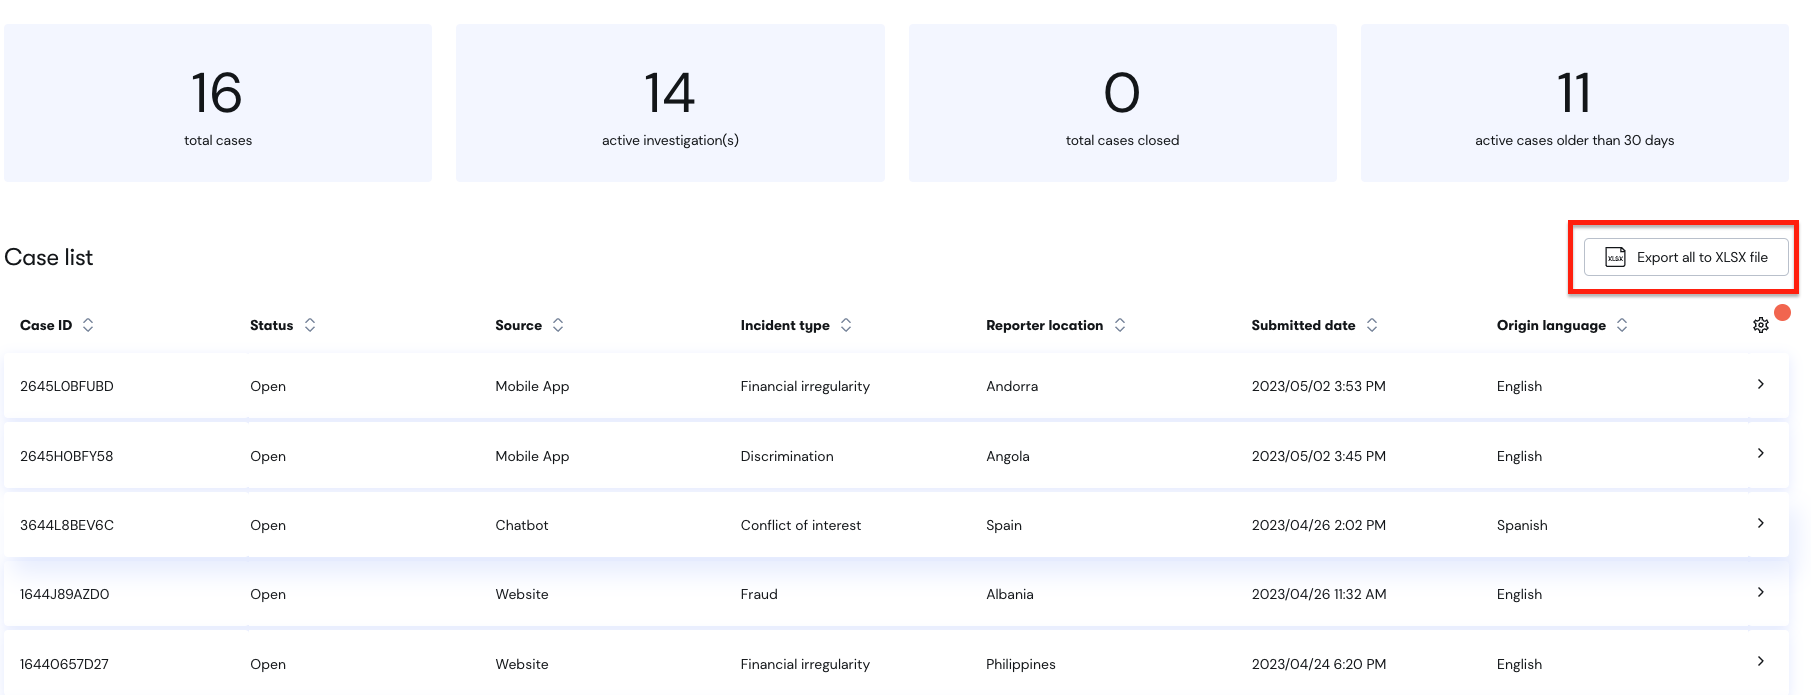
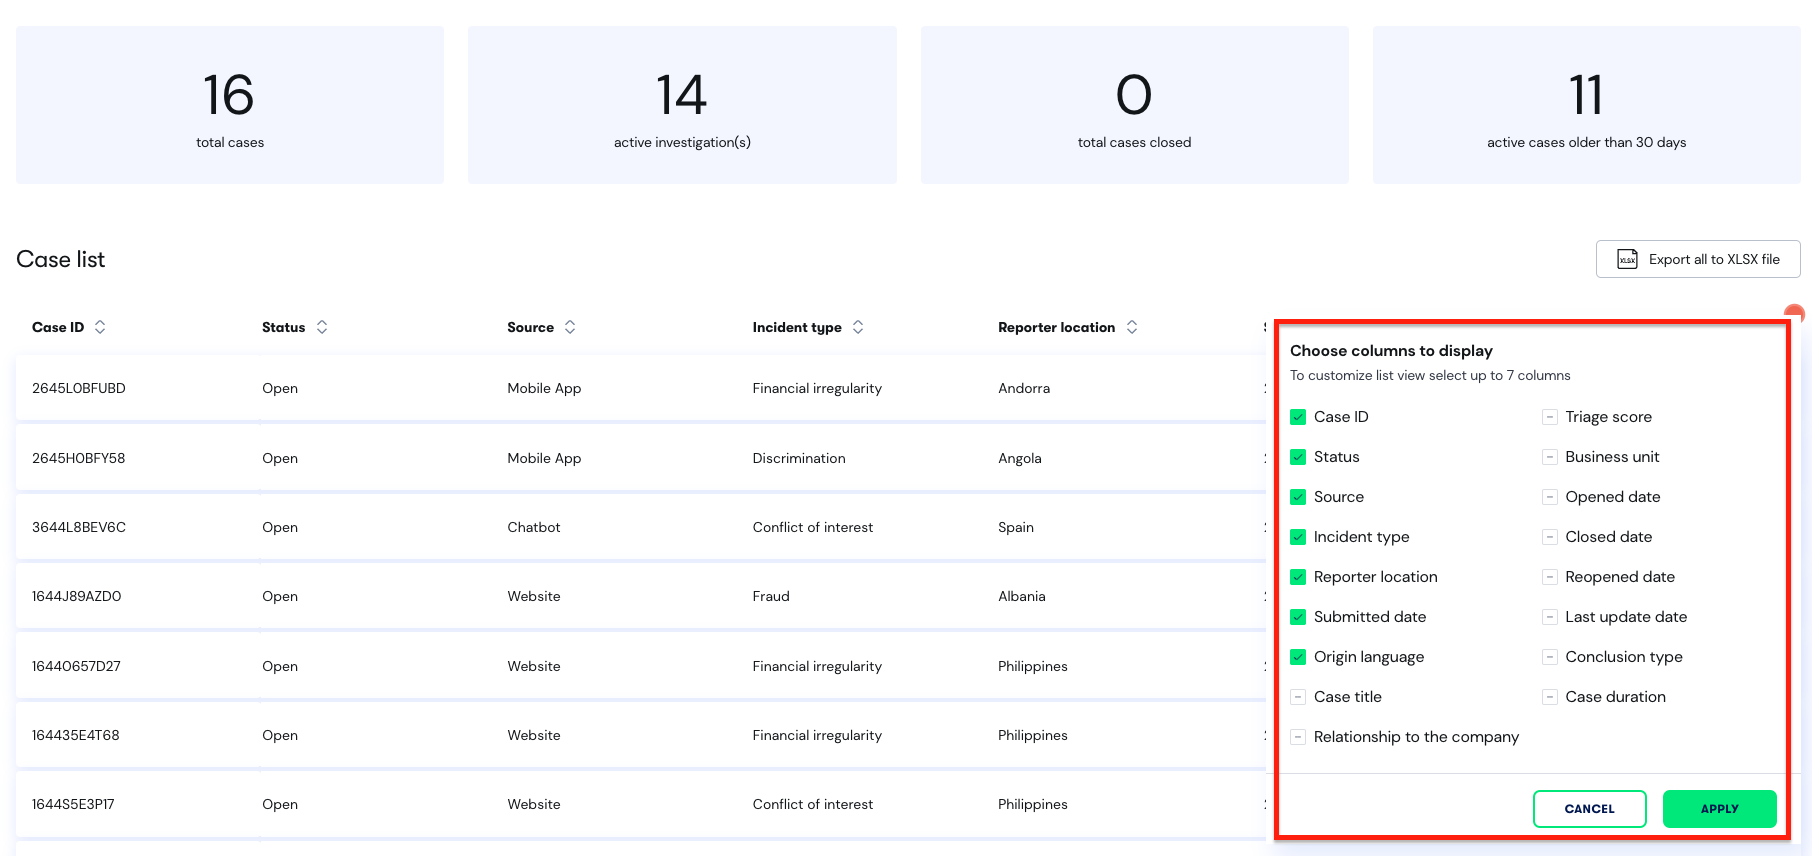
By default the dashboard will display Case ID, Status, Incident type, Reporter location, Submitted date, Origin language and Case title. You may change this display by clicking on the settings wheel and choosing other columns. You may only select 7 columns at a time. *This is not a limitation, this is to prevent inaccurate display on most laptop screens.
You may export your reports to Excel by choosing Extract All. This does not export report details.
*This is not a limitation, it is for security purposes for sensitive information.